India, in Infographics: Energy & Strategy
India’s Oil Supply Is Returning To Normal: Gulf Crude Is Back Ahead Of Russia For The First Time Since The Iran War Shut Hormuz
India’s Crude Imports From The Persian Gulf And Russia, September 2025 To November 2026, In Million Barrels A Day. Hover Or Tap A Month.
Each Pair Of Bars Is One Month: Persian Gulf And Russia, In Million Barrels A Day. September 2025 To August 2026 From Customs Data; November 2026 So Far From Kpler Tanker Tracking. Hover Or Tap A Month For The Numbers.
Through Hormuz, November
2.1 Mb/d
Ahead Of Russia’s 1.8, Per Kpler
Russia’s Share, July 2026
52%
Up From 27% In February
Gulf Share, July 2026
21%
Down From 54% In February
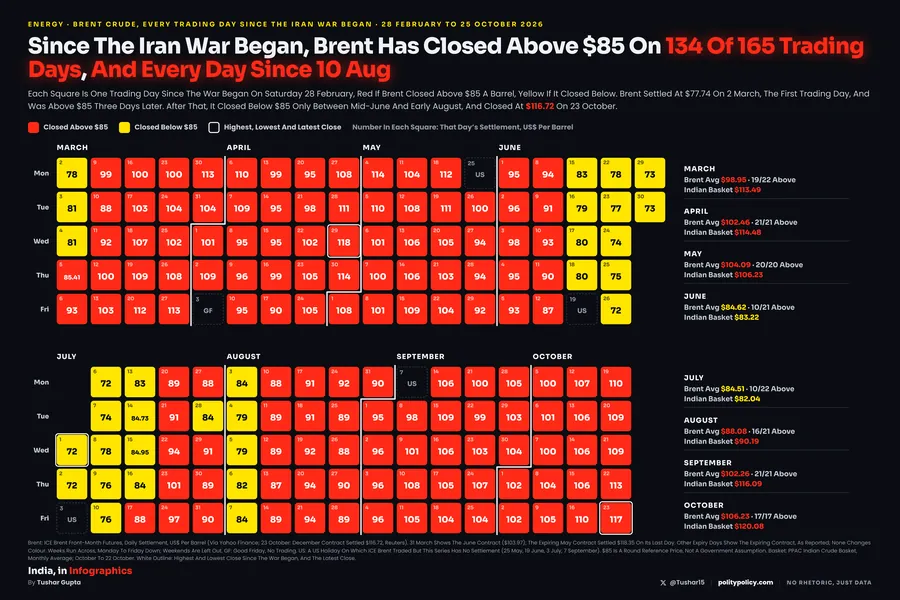
Brent Futures, 11 Nov
$92.76
Down 10% Since 3 November
The Bottom Line
The Iran War Cut The Gulf’s Share Of India’s Crude From 54% In February To 21% In July, As Russia Rose To 52%. In November, Kpler Data Show Gulf Crude Back Ahead Of Russia, While Brent Has Fallen From Its October High.
What Happened
The Shock
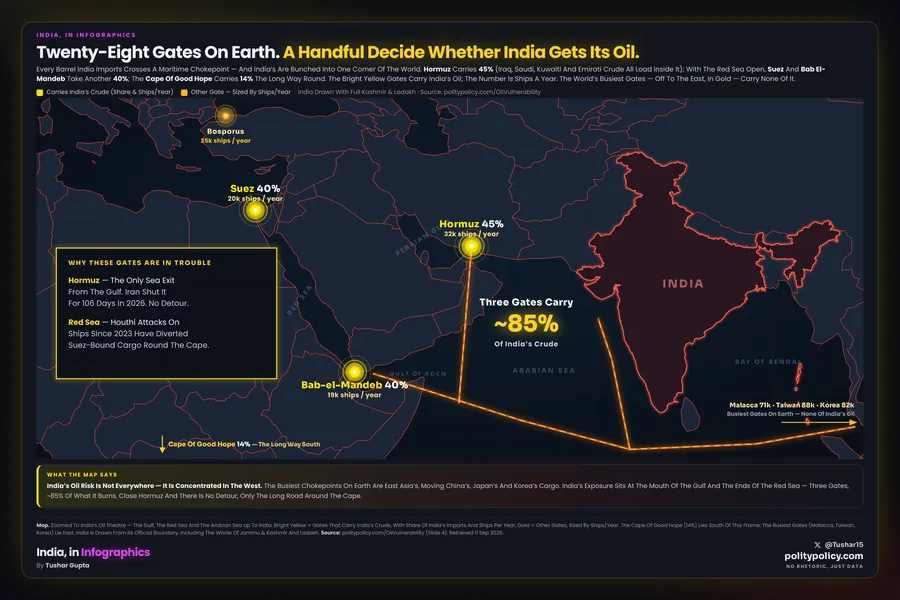
In February 2026, Before The Iran War, Persian Gulf Producers Supplied 54% Of India’s Crude Imports. Kpler Data Cited By Bloomberg Show Flows Through Hormuz To India Fell From A 2.8 Million Barrel A Day Average In February To 0.25 Million In April.
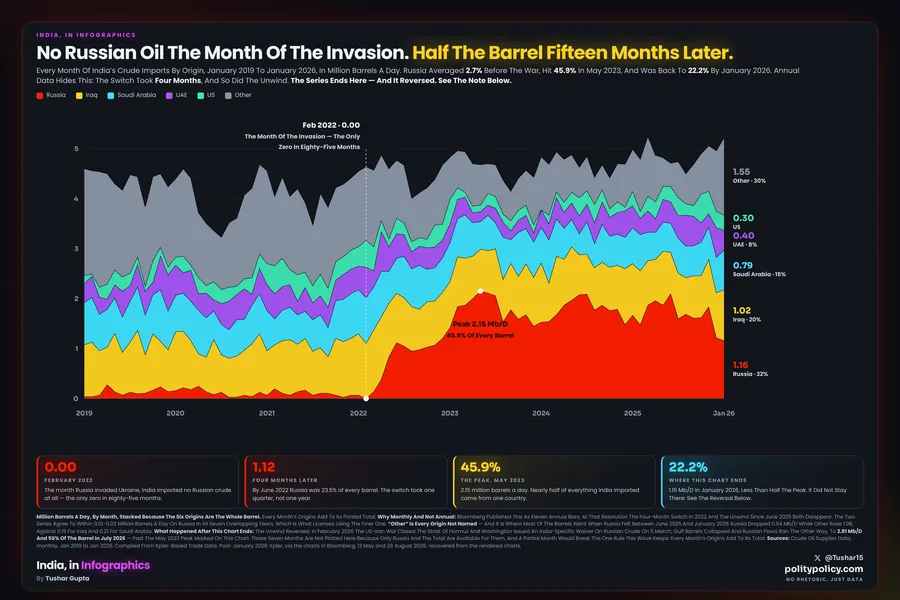
Russia Filled The Gap
Russia’s Share Rose From 27% In February To 52% In July, When India Imported 2.6 Million Barrels A Day From It. Venezuela And Oman, Which Ships From Outside Hormuz, Also Gained.
The Return
With Tankers Shuttling Through Hormuz Again, Kpler Puts Gulf Crude Reaching India At 2.1 Million Barrels A Day In November So Far, Against 1.8 Million From Russia: The First Time The Gulf Has Led Since The War Began.
Read With Care
Customs Months Are Lumpy
Official Figures Follow The Date Cargoes Are Cleared, So Single Months Swing. Tonnes Are Converted At 7.33 Barrels Per Tonne. April To August 2026 Are Provisional. Kpler Tanker Data, Used In Our Russian Oil Graphic, Put Russia At 2.81 Million Barrels A Day And 56% In July.
November Is A Different Source
The November Bars Are Kpler Tanker Tracking For The First Days Of The Month, As Reported By Bloomberg, Not Customs Data. Kpler Counts Crude Shipped Through Hormuz; The Customs Bars Count Six Gulf Countries.
Gaps
September And October 2026 Customs Data Were Not Yet Published On 12 November 2026. The EIA Brent Spot Series Ends On 3 November.
Sources & Method
Data
Department Of Commerce TRADESTAT, Commodity-Wise All Countries Import, HS 2709, Quantity, Calendar Year Months. Persian Gulf: Saudi Arabia, Iraq, UAE, Kuwait, Qatar And Iran. Kpler Via Bloomberg, 12 November 2026. Brent: EIA Europe Brent Spot (RBRTE) And CME Brent Last Day Financial Futures Settlements, January 2027 Contract.
Data: TRADESTAT · EIA · CME.