India, in Infographics: Politics
Through A Pandemic, Two Wars And Trump’s Tariffs, The NDA Won 26 Of 38 Elections, While India’s Inflation Peaked Less Than Half As Far Above Its Normal As In The US, UK Or Euro Area
Every State Assembly Election And The 2024 Lok Sabha Since The Covid Lockdown, The Crises On The Same Timeline, And India’s Inflation Against The US, UK And Euro Area. Tap A Block For The Seats.
Each Column Is A Half Year; Each Block Is An Election, By The Date Of Its Result. Tap A Block For The Seats Won By The Bloc That Formed The Government. Below, Red Marks Are The Crises, And The Lines Are Consumer Price Inflation: Switch Between The Rise Above Each Economy’s Own Pre-Covid Average And The Actual Rate. On A Phone Each Half Year Is A Row.
NDA Formed The Government
26 Of 38
37 Assembly Elections And The 2024 Lok Sabha
Congress Led
4 Of 38
Himachal, Karnataka, Telangana, Kerala
India’s Peak Over Normal
+3.6 Pts
7.8% In April 2022
UK And Euro Area Peaks
+9.6 Pts
US +7.5, All In 2022
The Bottom Line
Through The Pandemic, The Ukraine And Iran Wars And A US Tariff Fight, The BJP Or An NDA Ally Formed The Government After 26 Of 38 Elections. Over The Same Years India’s Inflation Rose 3.6 Points Above Its Pre-Covid Average At The Peak, Less Than Half The 7.5 To 9.6 Points Seen In The US, UK And Euro Area.
What The Data Shows
Wins Through Every Crisis
Of 38 Elections Since The Lockdown, The BJP Or An NDA Ally Formed The Government After 26. It Won In Every Half Year That Had A Poll, Including Bihar In November 2020 During The First Covid Wave, Uttar Pradesh Weeks After Russia Invaded Ukraine, And Bengal And Assam In May 2026 After The Iran War Began.
Congress Won Four
The Congress Led Governments After Himachal Pradesh (2022), Karnataka And Telangana (2023) And Kerala (2026), And Joined The NC In Jammu And Kashmir And The JMM In Jharkhand In 2024. Eight More Went To Other Non-NDA Parties: The TMC, DMK And LDF In 2021, AAP In Punjab, ZPM In Mizoram, The NC And JMM, And TVK In Tamil Nadu.
A Smaller Spike
India’s Inflation Peaked At 7.8% In April 2022, 3.6 Points Above Its 2015 To 2019 Average Of 4.2%. The US Peaked At 9.1% (7.5 Points Above Its Normal), The UK At 11.1% And The Euro Area At 10.6% (Both 9.6 Points Above).
Read With Care
Higher Normal, Higher Rate
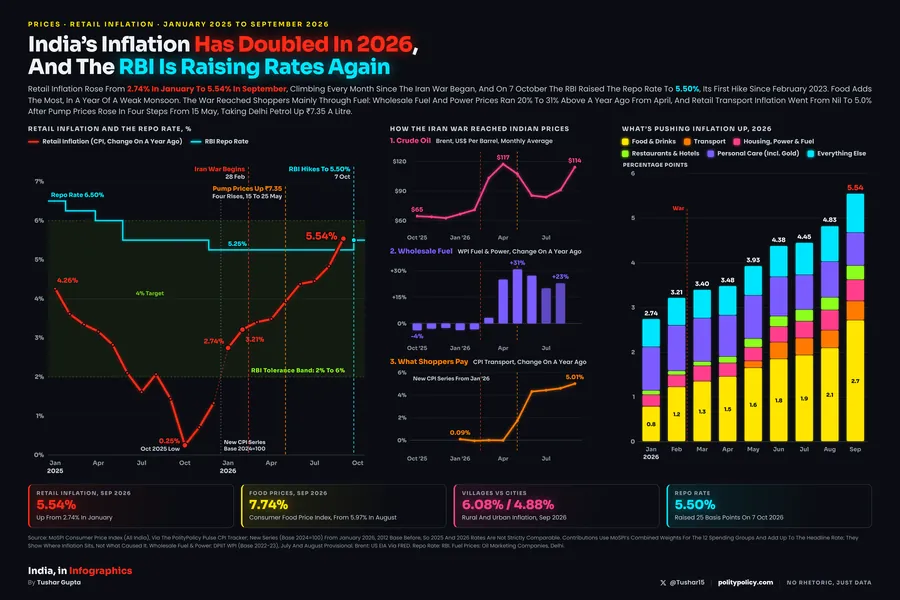
India’s Normal Inflation Is Higher Than The West’s. On The Actual Rate, India Was Above The US, UK And Euro Area In 41 Of 77 Months Since March 2020, Including All Of 2020 And 2024, And Below All Three Through 2022. It Was 5.54% In September 2026, Against 3.7% In The US. Switch To “Actual Rate” Above To See It.
Timing, Not Cause
The Chart Shows Elections, Crises And Prices On One Timeline. It Does Not Show That Prices Decided Any Election.
Who Counts As NDA
A Block Is Saffron When The Government Formed After The Result Was Led By The BJP Or A Party In The NDA At The Time: NPP In Meghalaya, SKM In Sikkim, AINRC In Puducherry, NDPP In Nagaland And TDP In Andhra Pradesh. In Goa In 2022 The BJP Won 20 Of 40 And Governed With MAG And Independents. In Tamil Nadu In 2026 TVK Won 108 Of 234 And Formed The Government With Outside Support.
Two Series For India
MOSPI Moved CPI To A 2024 Base In January 2026; Earlier Months Use The 2012 Base. It Did Not Compile CPI For April And May 2020. The US Has No Reading For October 2025.
Sources & Method
Elections
Seats Won By Each Party From The Election Commission’s Full Statistical Reports (Performance Of Political Parties) For Each Assembly Election, And Its 2024 General Election Report. Arunachal 2024 Adds 10 BJP Seats Won Unopposed; The Lok Sabha Count Adds Surat.
Inflation
Year On Year CPI: MOSPI (Combined, All India), US BLS CPI-U, UK ONS CPI, Euro Area Eurostat HICP. “Normal” Is Each Economy’s Average For January 2015 To December 2019.
Data: ECI Statistical Reports · MOSPI CPI, September 2026 · BLS CPI · ONS CPI · Eurostat HICP.