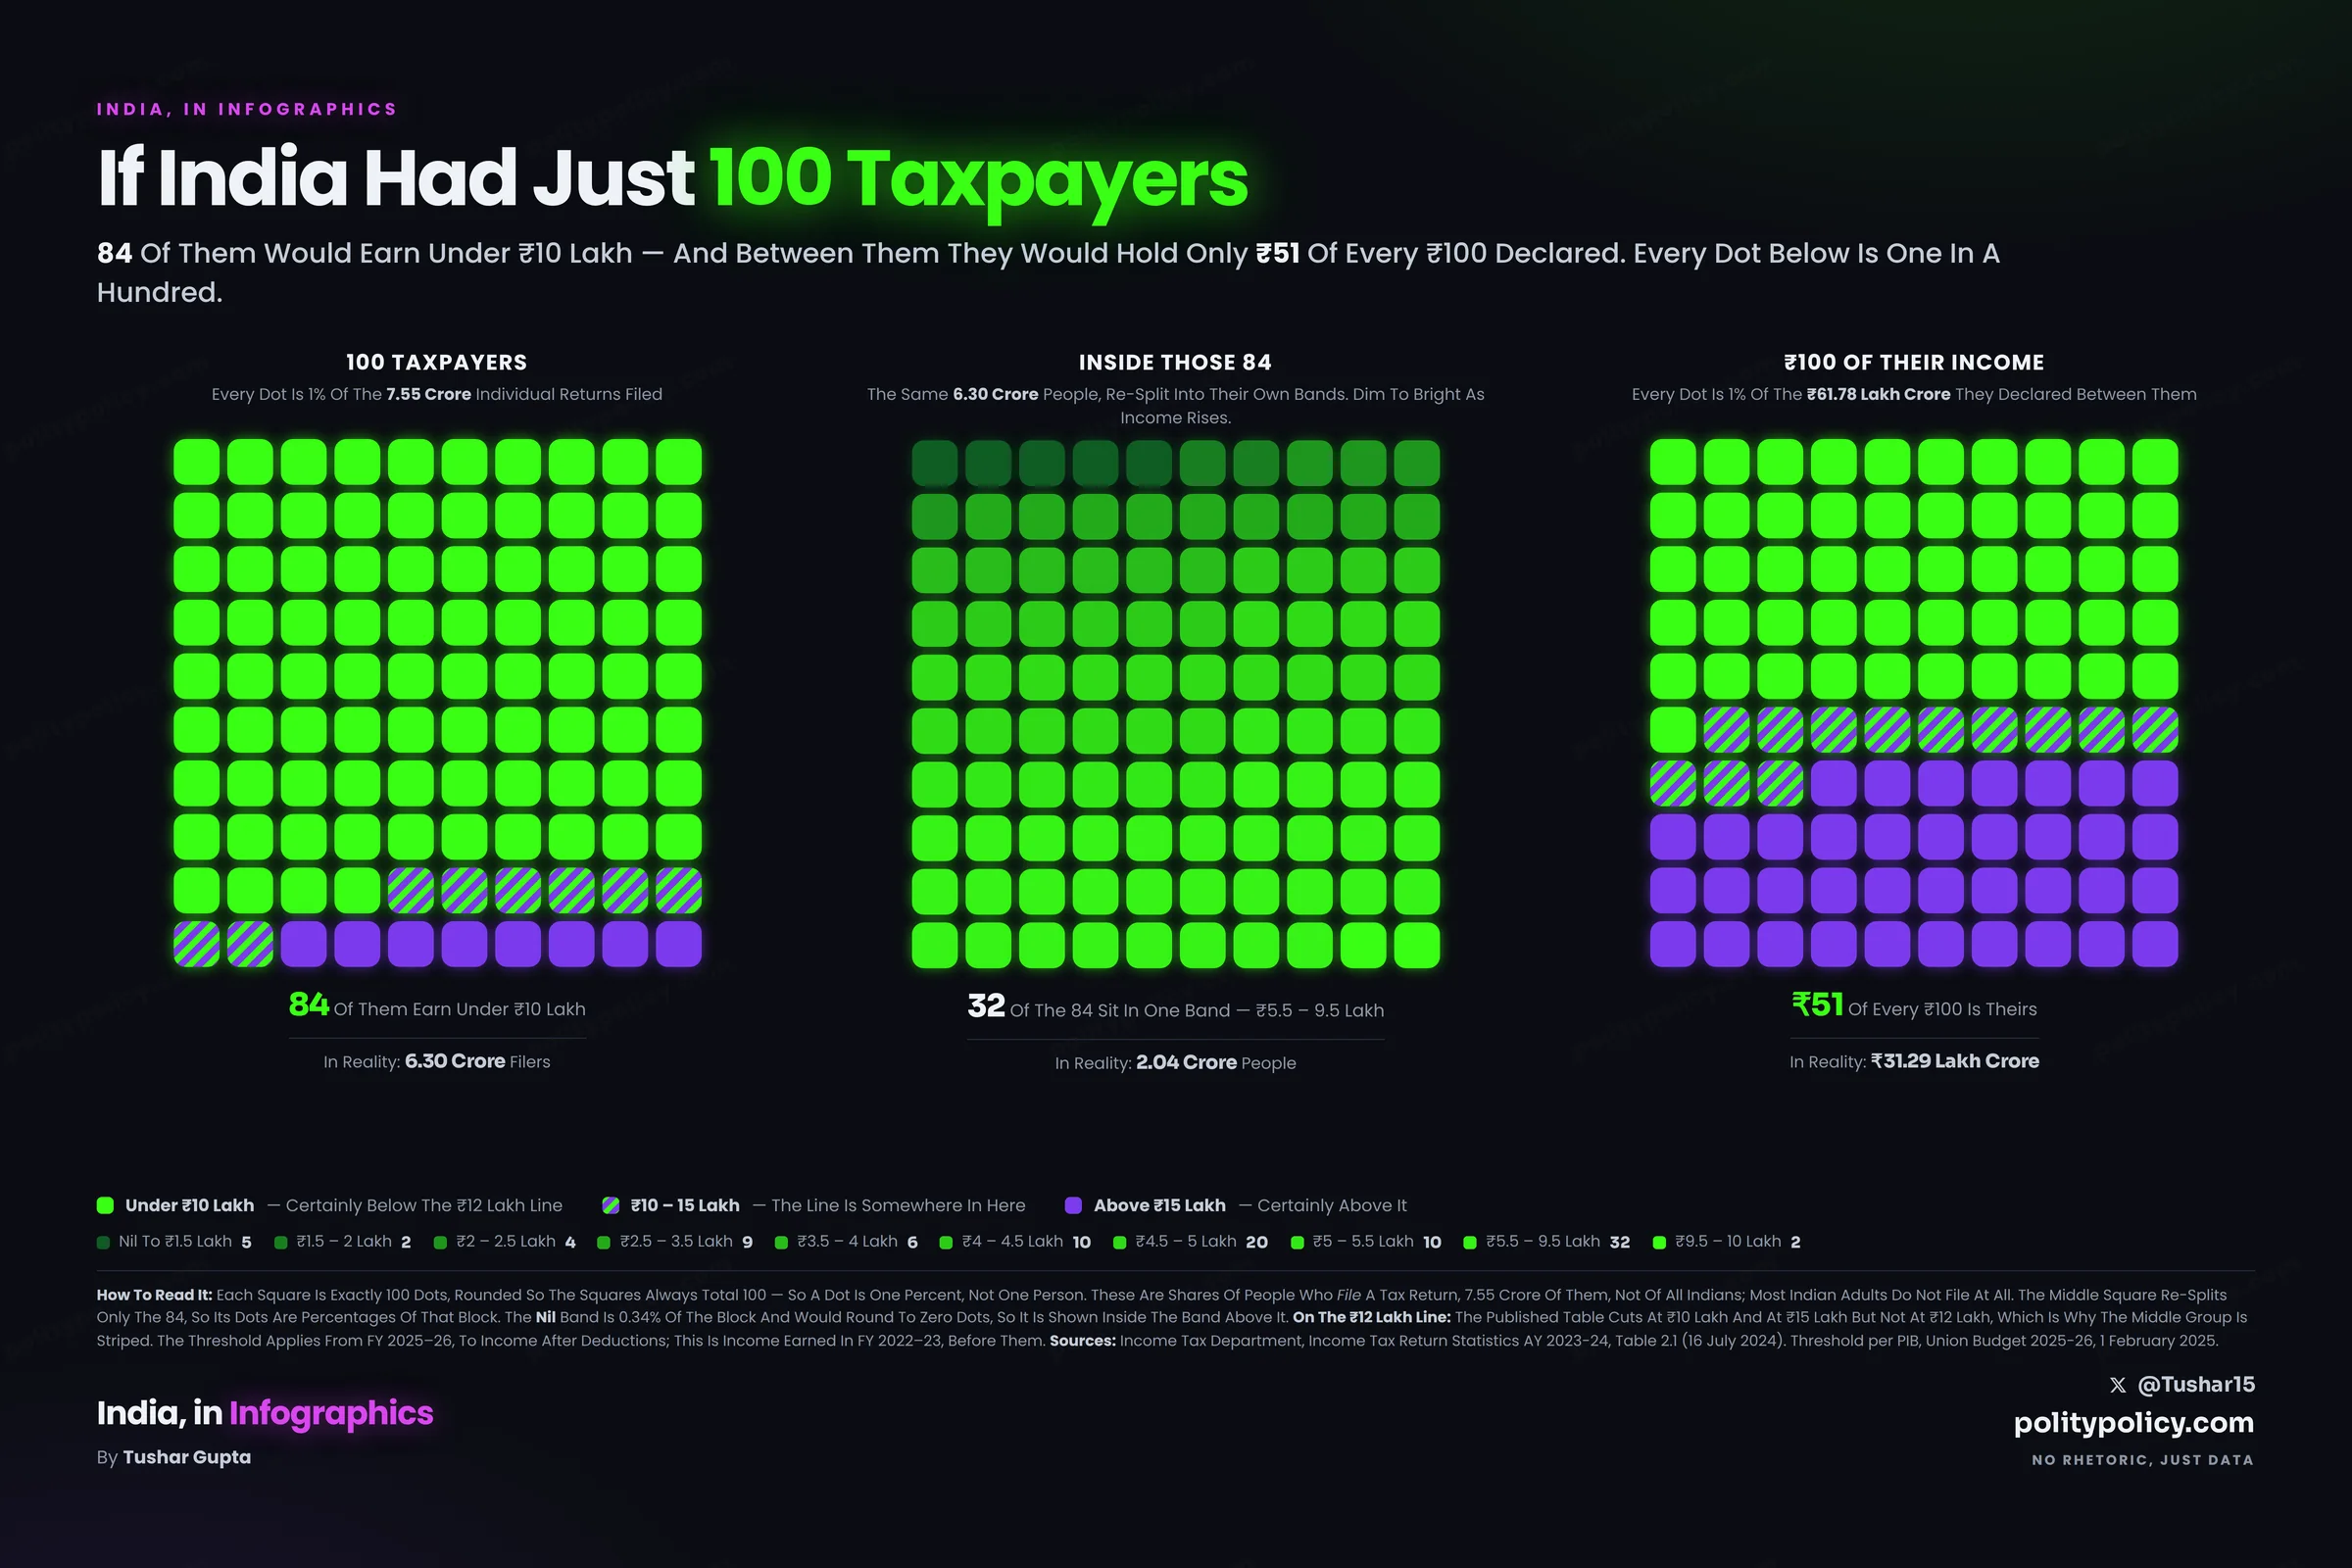
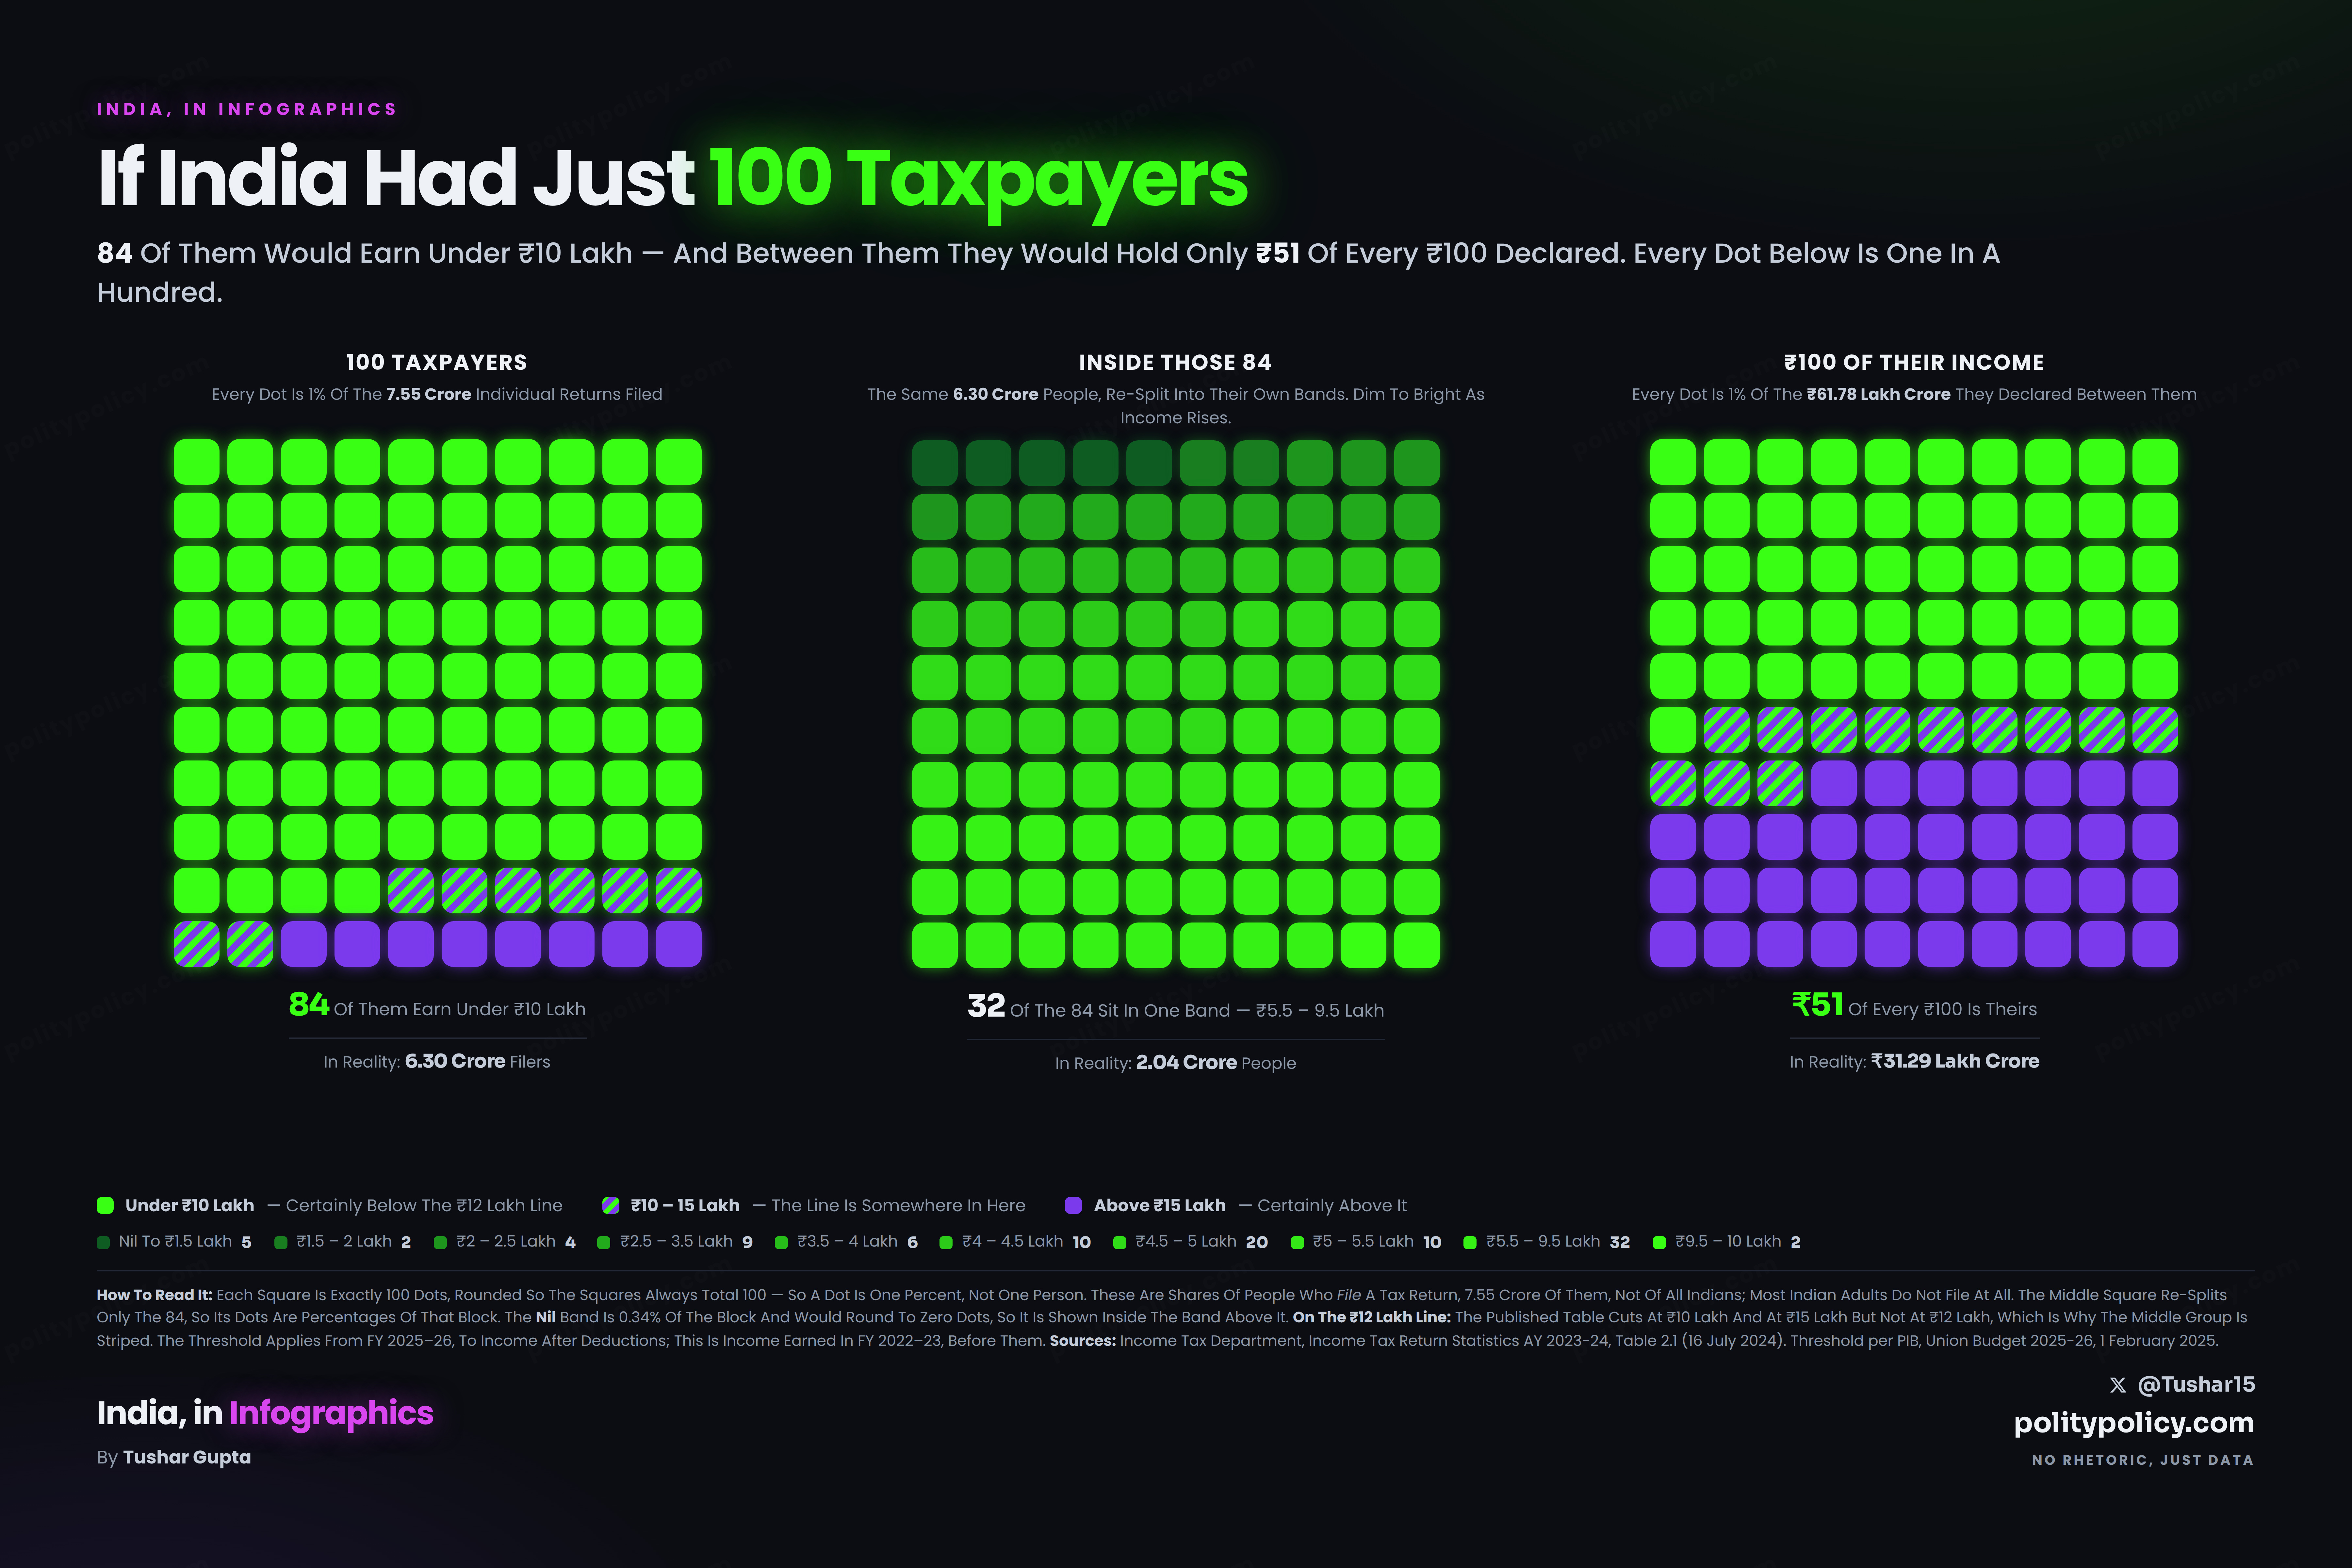
Inside The 84%
The middle square counts those 84 into their own income bands. Here they are as a single bar, each slice sized by its share of the block.
Nil0.3%of the 84%214,914 filers · 0.3% of all
Up To ₹1.5 Lakh5.1%of the 84%3,194,597 filers · 4.2% of all
₹1.5 – 2 Lakh2.2%of the 84%1,369,529 filers · 1.8% of all
₹2 – 2.5 Lakh4.2%of the 84%2,657,722 filers · 3.5% of all
₹2.5 – 3.5 Lakh9.0%of the 84%5,644,045 filers · 7.5% of all
₹3.5 – 4 Lakh6.3%of the 84%3,953,743 filers · 5.2% of all
₹4 – 4.5 Lakh9.4%of the 84%5,932,002 filers · 7.9% of all
₹4.5 – 5 Lakh19.9%of the 84%12,511,491 filers · 16.6% of all
₹5 – 5.5 Lakh9.7%of the 84%6,086,356 filers · 8.1% of all
₹5.5 – 9.5 Lakh32.4%of the 84%20,402,971 filers · 27.0% of all
₹9.5 – 10 Lakh1.7%of the 84%1,060,450 filers · 1.4% of all
Every slice is a share of the 84%, not of the whole country. The biggest single band is
₹5.5 – 9.5 Lakh at 32.4% of the block. Shading runs light to dark with income; the bar is the same
eleven rows you can read in the table below.
The Full Breakup
The graphic draws three groups. Underneath them sit the 23 income bands the Income Tax Department actually publishes. Browse either.
| Range Of Gross Total Income | Returns | Share Of Filers | Total Income | Share Of Income | Average |
|---|---|---|---|---|---|
| Under ₹10 LakhCertainly Below The Line | 63,027,820 | 83.5% | ₹3,129,027 cr | 50.6% | ₹4.96 L |
| ₹10 – 15 LakhThe Line Is Somewhere In Here | 6,228,002 | 8.3% | ₹750,685 cr | 12.2% | ₹12.05 L |
| Above ₹15 LakhCertainly Above The Line | 6,205,464 | 8.2% | ₹2,298,278 cr | 37.2% | ₹37.04 L |
| All Individual Returns | 75,461,286 | 100% | ₹6,177,988.85 cr | 100% | ₹8.19 L |
For perspective: India’s per capita income in the same year, FY 2022-23, was ₹1,69,496 — MoSPI First Revised Estimate, at current prices. The average filer declared ₹8.19 lakh, about 4.8× that; inside the under-₹10-lakh group the average is ₹4.96 lakh, about 2.9×.
What per capita income is, exactly: net national income divided by the whole population — children and everyone not earning are in the denominator. It is not a wage — net national income also counts company profits and government income that never reach a household, and it is a mean rather than a typical income, so most Indians sit below it. The filer averages beside it are declared income divided by filers only, who all have income by definition. The two therefore have different denominators, and the multiples should be read as a yardstick against the economy per head, not as one person’s pay against another’s. Both averages here are simple means: total ÷ count.
Why three? The published table cuts cleanly at ₹10 lakh and at ₹15 lakh, but it cannot be cut at ₹12 lakh. So the answer to the question is a range — between 83.5% and 91.8% of filers fall below the line — and the middle group is that uncertainty.
What per capita income is, exactly: net national income divided by the whole population — children and everyone not earning are in the denominator. It is not a wage — net national income also counts company profits and government income that never reach a household, and it is a mean rather than a typical income, so most Indians sit below it. The filer averages beside it are declared income divided by filers only, who all have income by definition. The two therefore have different denominators, and the multiples should be read as a yardstick against the economy per head, not as one person’s pay against another’s. Both averages here are simple means: total ÷ count.
Why three? The published table cuts cleanly at ₹10 lakh and at ₹15 lakh, but it cannot be cut at ₹12 lakh. So the answer to the question is a range — between 83.5% and 91.8% of filers fall below the line — and the middle group is that uncertainty.
| Range Of Gross Total Income | Returns | Of All Filers | Of Its Block | Total Income | Of All Income | Of Its Block |
|---|---|---|---|---|---|---|
| Under ₹10 LakhCertainly Below The Line · 83.5% of all filers, 50.6% of all income | ||||||
| Nil= 0 | 214,914 | 0.28% | 0.34% | ₹0.00 cr | 0.0% | 0.0% |
| Up To ₹1.5 Lakh>0 and <=1,50,000 | 3,194,597 | 4.2% | 5.1% | ₹22,778.25 cr | 0.37% | 0.73% |
| ₹1.5 – 2 Lakh>1,50,000 and <=2,00,000 | 1,369,529 | 1.8% | 2.2% | ₹24,130.04 cr | 0.39% | 0.77% |
| ₹2 – 2.5 Lakh>2,00,000 and <=2,50,000 | 2,657,722 | 3.5% | 4.2% | ₹61,683.18 cr | 1.00% | 2.0% |
| ₹2.5 – 3.5 Lakh>2,50,000 and <=3,50,000 | 5,644,045 | 7.5% | 9.0% | ₹171,210.33 cr | 2.8% | 5.5% |
| ₹3.5 – 4 Lakh>3,50,000 and <=4,00,000 | 3,953,743 | 5.2% | 6.3% | ₹148,462.23 cr | 2.4% | 4.7% |
| ₹4 – 4.5 Lakh>4,00,000 and <=4,50,000 | 5,932,002 | 7.9% | 9.4% | ₹252,624.35 cr | 4.1% | 8.1% |
| ₹4.5 – 5 Lakh>4,50,000 and <=5,00,000 | 12,511,491 | 16.6% | 19.9% | ₹601,690.39 cr | 9.7% | 19.2% |
| ₹5 – 5.5 Lakh>5,00,000 and <=5,50,000 | 6,086,356 | 8.1% | 9.7% | ₹317,589.36 cr | 5.1% | 10.1% |
| ₹5.5 – 9.5 Lakh>5,50,000 and <=9,50,000 | 20,402,971 | 27.0% | 32.4% | ₹1,425,500.73 cr | 23.1% | 45.6% |
| ₹9.5 – 10 Lakh>9,50,000 and <=10,00,000 | 1,060,450 | 1.4% | 1.7% | ₹103,357.74 cr | 1.7% | 3.3% |
| Subtotal — Under ₹10 Lakh | 63,027,820 | 83.5% | 100% | ₹3,129,026.60 cr | 50.6% | 100% |
| ₹10 – 15 LakhThe Line Is Somewhere In Here · 8.3% of all filers, 12.2% of all income | ||||||
| ₹10 – 15 Lakh>10,00,000 and <=15,00,000 | 6,228,002 | 8.3% | 100.0% | ₹750,684.74 cr | 12.2% | 100.0% |
| Subtotal — ₹10 – 15 Lakh | 6,228,002 | 8.3% | 100% | ₹750,684.74 cr | 12.2% | 100% |
| Above ₹15 LakhCertainly Above The Line · 8.2% of all filers, 37.2% of all income | ||||||
| ₹15 – 20 Lakh>15,00,000 and <=20,00,000 | 2,427,058 | 3.2% | 39.1% | ₹416,574.89 cr | 6.7% | 18.1% |
| ₹20 – 25 Lakh>20,00,000 and <=25,00,000 | 1,192,990 | 1.6% | 19.2% | ₹265,393.32 cr | 4.3% | 11.5% |
| ₹25 – 50 Lakh>25,00,000 and <=50,00,000 | 1,843,287 | 2.4% | 29.7% | ₹624,315.92 cr | 10.1% | 27.2% |
| ₹50 Lakh – 1 Crore>50,00,000 and <=1,00,00,000 | 514,814 | 0.68% | 8.3% | ₹347,526.64 cr | 5.6% | 15.1% |
| ₹1 – 5 Crore>1,00,00,000 and <=5,00,00,000 | 210,693 | 0.28% | 3.4% | ₹374,365.07 cr | 6.1% | 16.3% |
| ₹5 – 10 Crore>5,00,00,000 and <=10,00,00,000 | 10,386 | 0.01% | 0.17% | ₹70,580.75 cr | 1.1% | 3.1% |
| ₹10 – 25 Crore>10,00,00,000 and <=25,00,00,000 | 4,438 | 0.01% | 0.07% | ₹65,981.99 cr | 1.1% | 2.9% |
| ₹25 – 50 Crore>25,00,00,000 and <=50,00,00,000 | 1,077 | 0.00% | 0.02% | ₹36,896.84 cr | 0.60% | 1.6% |
| ₹50 – 100 Crore>50,00,00,000 and <=100,00,00,000 | 436 | 0.00% | 0.01% | ₹30,259.60 cr | 0.49% | 1.3% |
| ₹100 – 500 Crore>100,00,00,000 and <=500,00,00,000 | 262 | 0.00% | 0.00% | ₹48,062.78 cr | 0.78% | 2.1% |
| Above ₹500 Crore>500,00,00,000 | 23 | 0.00% | 0.00% | ₹18,319.71 cr | 0.30% | 0.80% |
| Subtotal — Above ₹15 Lakh | 6,205,464 | 8.2% | 100% | ₹2,298,277.51 cr | 37.2% | 100% |
| All Individual Returns | 75,461,286 | 100% | — | ₹6,177,988.85 cr | 100% | — |
This is the breakup of the 84% and the 51%. Each band sits under the block it belongs to, and the last two columns show what share of that block it makes up — so you can see exactly which bands build the green 84% of filers and 51% of income, and which build the yellow 8% and 37%. Table 2.1, verbatim. Returns and income are exactly as published; shares and averages are computed from them and reconcile to the printed totals. The published table also lists a < 0 row, which is empty for this year. Scroll the table to see all 23 bands. Source: Income Tax Department, Income Tax Return Statistics AY 2023-24, published 16 July 2024. AY 2023-24 is income earned in FY 2022-23.