India, in Infographics: Economy
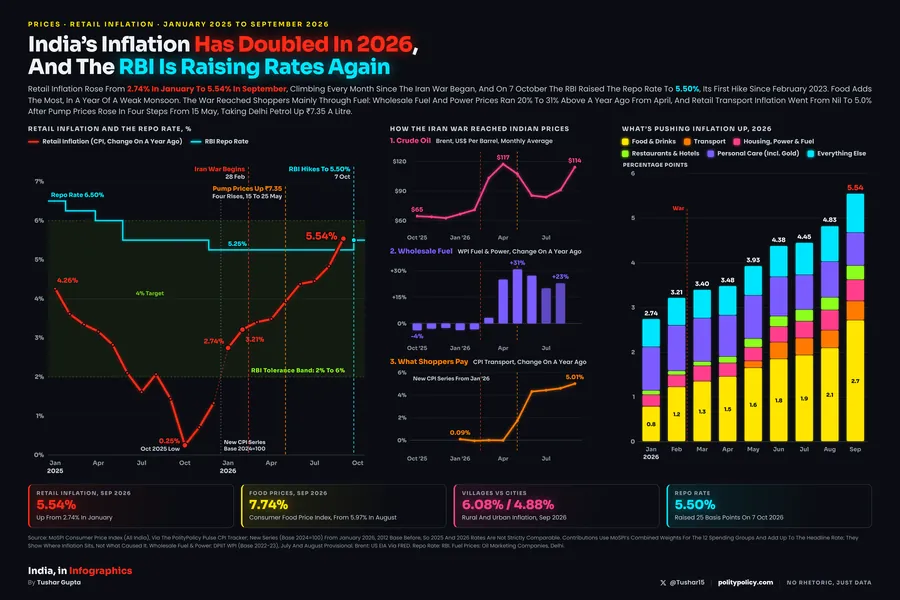
Before The 2026 Midterms, US Inflation Rose From 2.4% To 3.7% On A War-Driven Fuel Shock, Not Broad Price Rises: Gasoline Is Up 45.5% And Airfares 12.6% Since The Iran War Began
US Consumer Prices Since The Iran War Began On 28 February 2026, Against The Same Months Of 2025, With Annual Inflation Each Month And Since 2010. Switch Views Or Hover For The Figures.
Since The Iran War Compares Prices In September 2026 With February 2026, The Last Month Before The War Began On 28 February, And Shows The Same Months Of 2025 As A Thin White Bar. Last 12 Months Is September 2026 Against September 2025. Inflation Each Month Is The Annual Rate For All Items, Energy And Everything Else. Since 2010 Shows Annual Average Inflation. Hover Or Tap For The Figures.
Annual Inflation
2.4% → 3.7%
February To September 2026; Peak 4.2% In May
Gasoline Since February
+45.5%
+2.3% In The Same Months Of 2025
Energy Since February
+23.2%
+2.8% In The Same Months Of 2025
Everything Except Energy
+1.7%
The Same As In 2025 (+1.7%)
The Bottom Line
US Inflation Rose From 2.4% Before The Iran War To 3.7% In September, Ahead Of The 2026 Midterms. Almost All Of The Rise Was Energy: Gasoline Rose 45.5% Since February, While Prices Excluding Energy Rose 1.7%, The Same As A Year Earlier.
What The Data Shows
A Fuel Shock
Gasoline Prices Fell Through The Winter, Then Rose 45.5% Between February And September 2026, Against 2.3% Over The Same Months Of 2025. Energy As A Whole Rose 23.2%. The Annual Rate For Energy Went From 0.5% In February To 23.5% In May And 20.4% In September.
Flights Followed Fuel
Airfares Rose 12.6% Since February, After Falling 1.6% Over The Same Months Of 2025, And Are Up 22.4% On A Year Earlier.
Everything Else Held Steady
Excluding Energy, Prices Rose 1.7% Since February, The Same As A Year Earlier; Their Annual Rate Moved From 2.5% To 2.6%. Groceries Rose 0.9% And Beef 1.1%, Both Slower Than In 2025. Eggs, Piped Gas And Car Insurance Got Cheaper.
Why 3.7% Matters In America
From 2010 To 2020 US Inflation Averaged 1.7% A Year And Reached 3% Only Once, In 2011. It Peaked At 8.0% In 2022. The Latest Annual Rate, 3.7%, Is More Than Twice The 2010s Average.
Read With Care
Prices, Not Votes
This Shows What Prices Did Before The Midterms. It Does Not Measure Why People Voted As They Did; Exit Polls Are The Place For That.
Seven Months, Not Six
The War Began On 28 February, So February Is The Last Month Before It. Gasoline Rose About 25% In March Alone, So A March Start Would Miss The First Jump.
Seasons And Gaps
These Indexes Are Not Seasonally Adjusted, So Each Change Is Set Against The Same Months Of 2025. BLS Published No October 2025 Index For Most Items Because Of The Federal Shutdown.
Sources & Method
Prices
Consumer Price Index For All Urban Consumers (CPI-U), US City Average, Not Seasonally Adjusted, From The US Bureau Of Labor Statistics. Index Levels Checked Against The CPI News Releases For September 2025, February 2026 And September 2026.
Long View
Annual Average Inflation From The BLS Historical CPI-U Table; The 2010 To 2020 Average Is Compounded From The 2009 And 2020 Annual Averages.
Data: BLS CPI, September 2026 · BLS CPI, February 2026 · BLS CPI, September 2025 · BLS Historical CPI-U.