India, in Infographics: Markets
When America’s Yields Rise, Foreign Money Leaves India
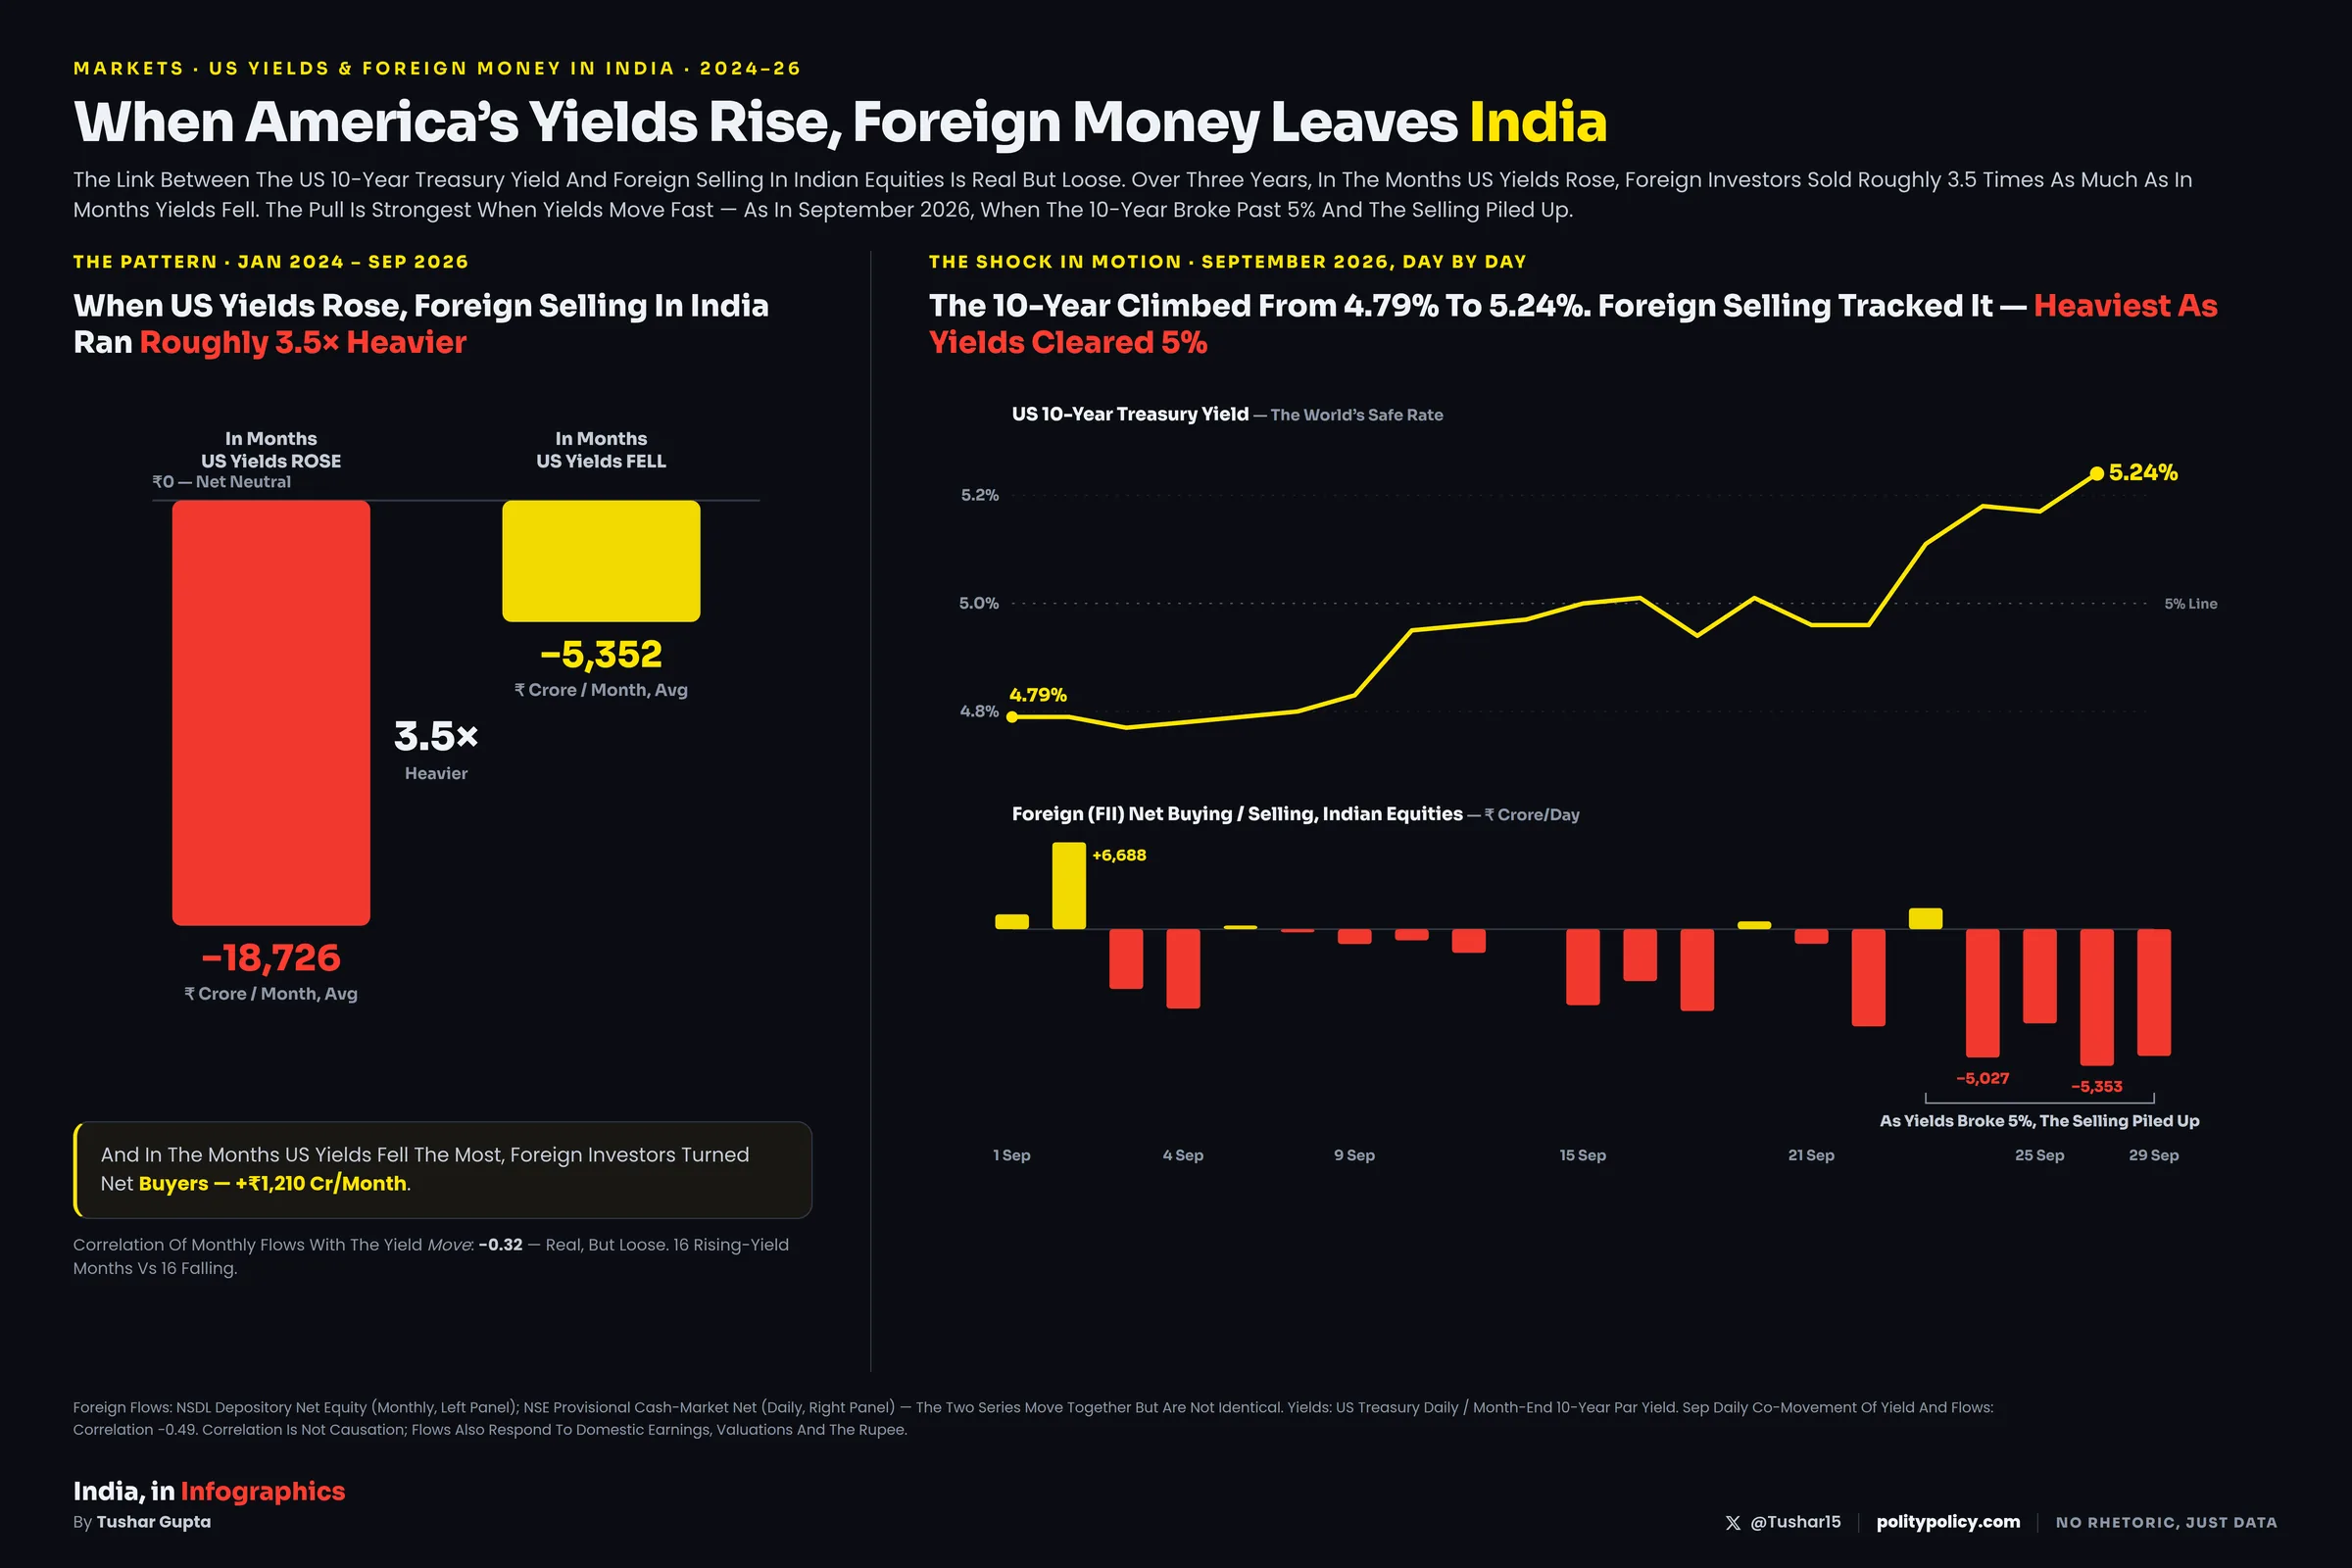
The Link Between The US 10-Year Treasury Yield And Foreign Selling In Indian Equities Is Real But Loose. Over Three Years, In The Months US Yields Rose, Foreign Investors Sold Roughly 3.5 Times As Much As In Months Yields Fell — And The Pull Was Strongest When Yields Moved Fast, As In September 2026, When The 10-Year Broke Past 5% And The Selling Piled Up.
Left: The Three-Year Pattern — Average Monthly Foreign Flows In Months US Yields Rose Versus Fell. Right: September 2026, Day By Day — The 10-Year Yield Against Daily Foreign Buying And Selling. The Two Panels Use Two Flow Series (NSDL Monthly; NSE Provisional Daily), Which Track Each Other But Differ.
US 10-Yr Treasury
5.24%
Late September 2026 · The World’s Safe Rate
Foreign Selling, September
−₹23,884 Cr
Net, Provisional Cash Segment (To 28th)
Heavier When Yields Rise
3.5×
Avg Monthly Selling Vs Falling-Yield Months
September Daily Co-Movement
−0.49
Yield Level Vs Foreign Flows — A Real Link
The Verdict
The Connection Is Real But Loose. Over Three Years, Foreign Investors Sold Roughly 3.5 Times As Much In The Months US Yields Rose As In The Months They Fell — And When Yields Fell Hardest, They Turned Net Buyers. But Month To Month The Link Is Weak (−0.32); It Tightens Only When Yields Move Fast, As In September 2026, When The 10-Year Cleared 5% And The Daily Selling Tracked It (−0.49). Yields Are One Force Among Several — Earnings, Valuations And The Rupee Move The Money Too.
How It Works, Step By Step
In Plain Terms: The US 10-Year Treasury Yield Is The Rate The World Treats As Safe. When It Climbs, Safe Dollar Bonds Start To Out-Reward Riskier Emerging-Market Shares, So Global Money Rotates Home Towards Them — And Some Of It Leaves India. The Chain Below Is The Tendency, Not A Guarantee; It Pulls Hardest When Yields Move Fast.
US Yields Rise→Safe Bonds Out-Reward Risk→Money Rotates To Dollars→Foreign Investors Sell India
What’s Going On — In Four Points
1 · The Trigger — A Rising ‘Safe’ Rate
The US 10-Year Treasury Yield Is The Benchmark The World Treats As Risk-Free. Through 2024–26 It Climbed Toward Multi-Decade Highs, Reaching 5.24% By Late September 2026. When The Safe Rate Rises, Every Riskier Asset On Earth Is Quietly Repriced Against It.
2 · The Mechanism — Money Rotates Home
Higher US Yields Make Dollar Bonds More Rewarding Relative To Riskier Emerging-Market Stocks. Global Funds Shift Money Out Of Markets Like India And Into US Assets. That Rotation Is What Shows Up In The Data As Foreign Investors Net-Selling Indian Equities.
3 · The Catch — A Tendency, Not A Switch
Month To Month The Link Is Loose — Correlation −0.32. Foreign Investors Also Weigh India’s Own Earnings, Valuations And The Rupee; In Mid-2026 They Bought Even As Yields Rose. The Pull Is Strongest When Yields Move Fast — During Shocks. In September 2026 The Daily Correlation Was −0.49.
4 · The Amplifier — A Weaker Rupee
A Falling Rupee And Costlier Oil Deepen The Blow. When The Rupee Weakens, Foreign Investors’ Dollar Returns Shrink And India’s Import Bill Rises. So The Same Yield Shock Can Hit India Harder Than It Hits The Very US Market That Set It Off.
Sources & Method
The Data
Foreign Flows: NSDL Depository Net Equity (Monthly, Long-Run Panel) And NSE Provisional Cash-Market Net (Daily, September Panel) — The Two Series Move Together But Are Not Identical. Yields: US Treasury Daily And Month-End 10-Year Par Yield. Period: January 2024 To September 2026.
The Honest Caveat
Correlation Is Not Causation. The Monthly Link Between Yields And Flows Is Real But Loose (−0.32 Against Yield Moves); It Tightens During Shocks (−0.49 Daily In September). Flows Also Respond To Domestic Earnings, Valuations, Oil And The Rupee — Yields Are One Force Among Several, Not The Only One.
Provisional Cash Figures Exclude Primary-Market And Bulk/Block Deals And Are Revised Later. September Month-To-Date Foreign Selling: −₹23,884 Crore (Provisional, To The 28th) Versus −₹20,695 Crore On The NSDL Depository Series. Retrieved Late September 2026.