India, in Infographics: Energy
Brent Is Up 71% In A Year; Petrol At India’s Pumps Is Up About 8%
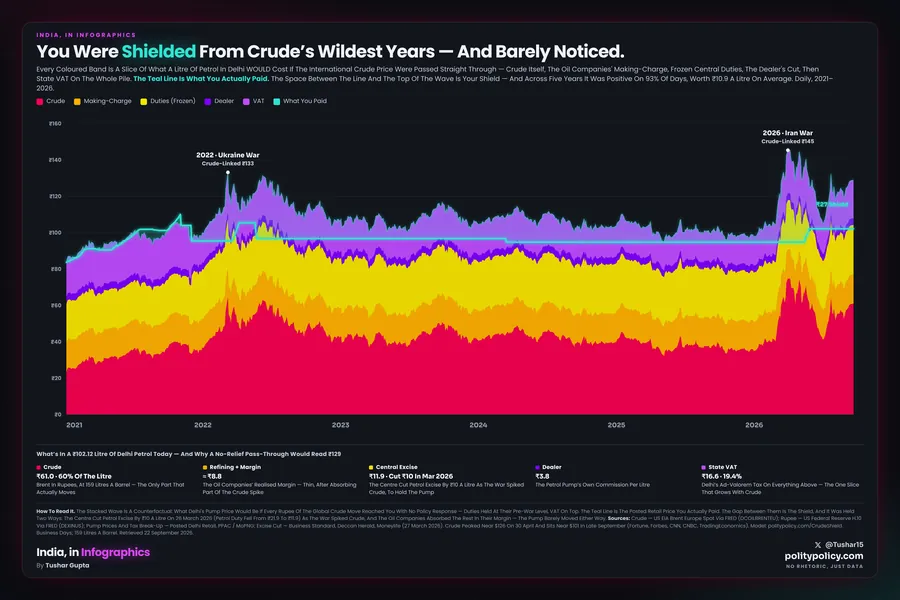
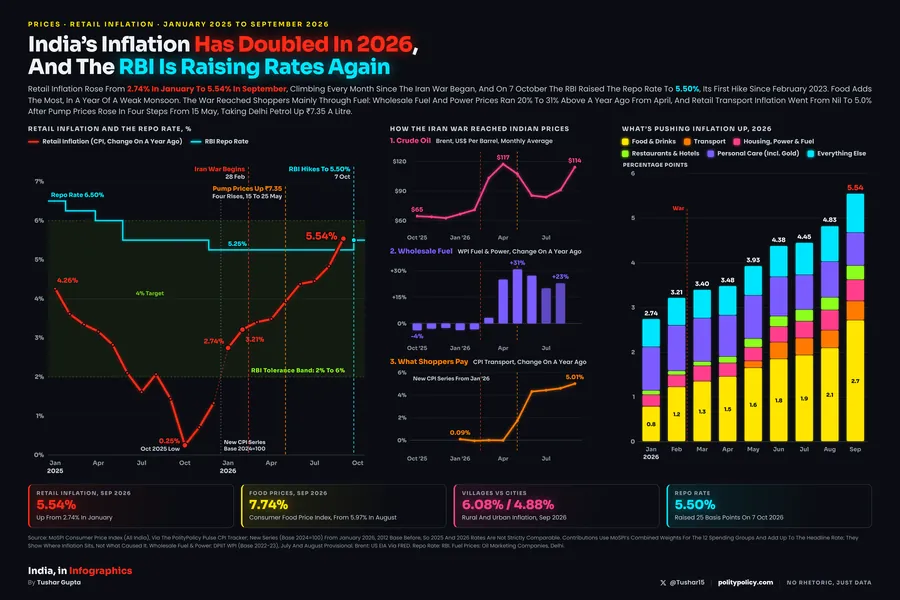
India’s Crude Basket Has Averaged $120.08 In October, Up 85% In A Year. Petrol In Delhi Rose From ₹94.77 To ₹102.12, After A ₹10 Excise Cut In March And Four Pump Revisions In May.
Hover Any Day For Brent, The Physical Brent Price, India’s Crude Basket For That Month, And The Petrol Price In Delhi, Mumbai And Bengaluru. Left Axis $50 To $140; Right Axis ₹80 To ₹125. Shaded: Since The Iran War Began On 28 February 2026.
Brent Futures, One Year
+71%
$65.99 To $113.17 (22 Oct Close)
Indian Crude Basket
+85%
$65.08 To $120.08 (October Average)
Delhi Petrol
+7.8%
₹94.77 To ₹102.12; Mumbai +7.4%, Bengaluru +7.8%
Excise Cut, 26 March
₹10
Special Excise On Petrol ₹13 To ₹3 A Litre
The Bottom Line
World Crude Rose 71% To 85% In A Year Depending On The Measure, With Swings Of More Than $30 A Barrel Within Weeks. Petrol In India’s Big Cities Rose About 8%, In One Burst Of Four Revisions In May; The Excise Cut In March And Oil Companies’ Margins Absorbed The Rest.
What The Data Shows
World Crude Has Swung Hard
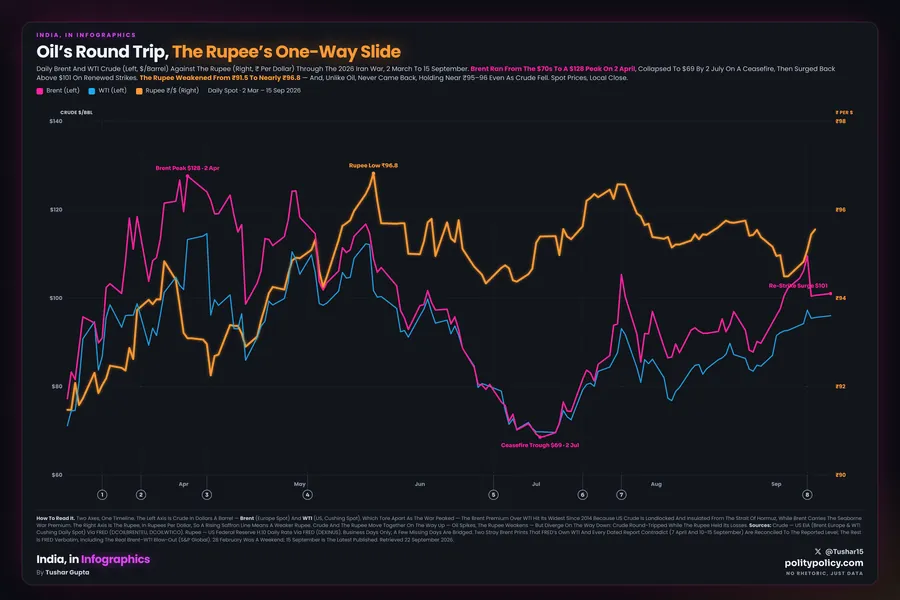
Brent Futures Started The Year At $65.99, Fell To $58.92 On 16 December, Then Jumped Above $100 Within Two Weeks Of The Iran War Beginning On 28 February. They Fell To $73.74 When Tankers Moved Through Hormuz In June, And Climbed Back As Attacks Hit Saudi Supply. On 22 October They Closed At $113.17, The Highest Close Since 4 May.
India’s Crude Costs More Than The Headline
India’s Crude Basket Follows Physical Cargoes (Dated Brent, Oman And Dubai), Which Have Sold Well Above Futures When Supply Is Tight. In October It Has Averaged $120.08, About $15 Above Brent Futures And Its Highest Month Since The War Began. On 2 October Physical Brent Was $135.51 Against $102.25 For Futures.
The Pump Moved Once
Petrol In Delhi Stayed At ₹94.77 For Nearly Seven Months, Through The First Spike Above $110. Oil Companies Then Raised Prices Four Times Between 15 And 25 May, To ₹102.12, And Have Not Changed Them Since. Mumbai Went From ₹103.50 To ₹111.21 And Bengaluru From ₹102.92 To ₹110.93: Each About 8%.
The Excise Cut Absorbed The First Shock
On 26 March The Centre Cut The Special Excise On Petrol From ₹13 To ₹3 A Litre, And On Diesel From ₹10 To Nil. Pump Prices Did Not Fall: The Cut Went Into Oil Companies’ Margins, Which Were Under Water With Crude Above $100, And Held Retail Prices Steady Until Mid-May.
Read With Care
Which Brent
The Chart Uses ICE Brent Front-Month Futures At Each Day’s Settlement, To 22 October. On 23 October Brent Traded Above $114 During The Day; That Is Shown As A Hollow Dot, Not A Close. On A Contract’s Expiry Day The Front-Month Price Can Jump; 31 March ($118.35) Is One Such Day.
Physical Brent
The Orange Line Is The EIA’s Europe Brent Spot Price, A Widely Used Proxy For Dated Brent, The Price Of Physical Cargoes. The Platts Dated Brent Assessment Itself Peaked Higher, At $144.42 On 7 April. EIA Data Run To 20 October.
Pump Prices By City
Retail Prices Change Only On Revision Days, So The City Lines Are Steps. Prices Differ Slightly Between Oil Companies And Outlets: Some Listings Show Bengaluru At ₹111.68 Rather Than ₹110.93, Which Would Make Its Rise 8.5%.
Sources & Method
World Crude
Brent: ICE Front-Month Futures, Daily Settlement (Via Yahoo Finance), Checked Against Reported Settlements For 20 March, 30 April, 4 May, 24 June And 22 October. Physical Brent: EIA Europe Brent Spot Price FOB, Via FRED (DCOILBRENTEU).
Indian Basket
PPAC (Ministry Of Petroleum And Natural Gas), Crude Oil FOB Price (Indian Basket), Monthly Average Of Daily Prices, FY2025-26 And FY2026-27. October 2026 Is The Average To 22 October; The Basket Was $119.99 On 22 October. Sweet To Sour Ratio In October 2026: 65.27 : 34.73.
Petrol And Excise
Retail Selling Price Of Petrol In Delhi And Mumbai From Indian Oil/PPAC Posted Prices; Bengaluru From Reports Of Each Revision (The Hindu, DriveSpark, Chenab Times). Revisions: 15, 19, 23 And 25 May 2026. Excise: Notification 05/2026-Central Excise, 26 March 2026.
Data: PPAC, Indian Basket · FRED, Brent Spot (EIA) · EIA, Crude Prices In Q3 2026 · Indian Oil, Retail Prices.