India, in Infographics: Energy & Geopolitics
Oil Falls To $92 And The Rupee Recovers, From ₹96.8 At Its Weakest To ₹94.1
Daily Brent And WTI Crude (Left, $/Barrel) Against The Rupee (Right, ₹ Per Dollar) Through The 2026 Iran War, 16 February To 16 November. Brent Spot Rose From $71 Before The War To $138 On 7 April, Fell To $69 By 2 July, Peaked Again At $136 On 2 October And Was $92 On 11 November. The Rupee Weakened From ₹91.0 To ₹96.8 On 20 May; It Was ₹94.86 On 3 November, Before The US Midterm Results, And ₹93.77 On 12 November, Its Strongest Since 21 April.
Click A Numbered Event To Drop A Marker Line Through The Chart; Click Several To Compare The Before And After. The Lines Are Daily Spot Prices; The War-Risk Premium Toggle Shows A Few Reported Insurance Quotes, Not A Daily Series.
What The War Cost India · Crude Import Bill, April To August (FY27)
$74.8bn
Crude Import Bill
+48% Year-On-Year: $24.4 Bn More For Almost The Same Oil (Volumes Down 0.4%)
₹7trillion
The Same Bill, In Rupees
+62% Year-On-Year, Because The Rupee Was Weaker Too
$147bn
Merchandise Trade Deficit
Widened From $124 Bn; Petroleum Is Now 22.5% Of All India’s Imports
India Imports 88% Of Its Crude; The Indian Basket Hit $123.86 A Barrel On 18 September, From $99.35 On 2 September. Source: PPAC Via Business Standard, 22 September 2026.
Brent Spot Peak
$138
7 April, After China And Russia Vetoed The UN Resolution On The Strait; It Was $71 Before The War.
Ceasefire Trough
$69
2 July, After The Geneva Deal To Reopen Hormuz. Brent Spot Peaked Again At $136 On 2 October And Was $92 On 11 November.
Rupee At Its Weakest
₹96.8
20 May, From ₹91.0 Before The War. It Was ₹96.8 As Late As 8 October.
Rupee On 16 November
₹94.1
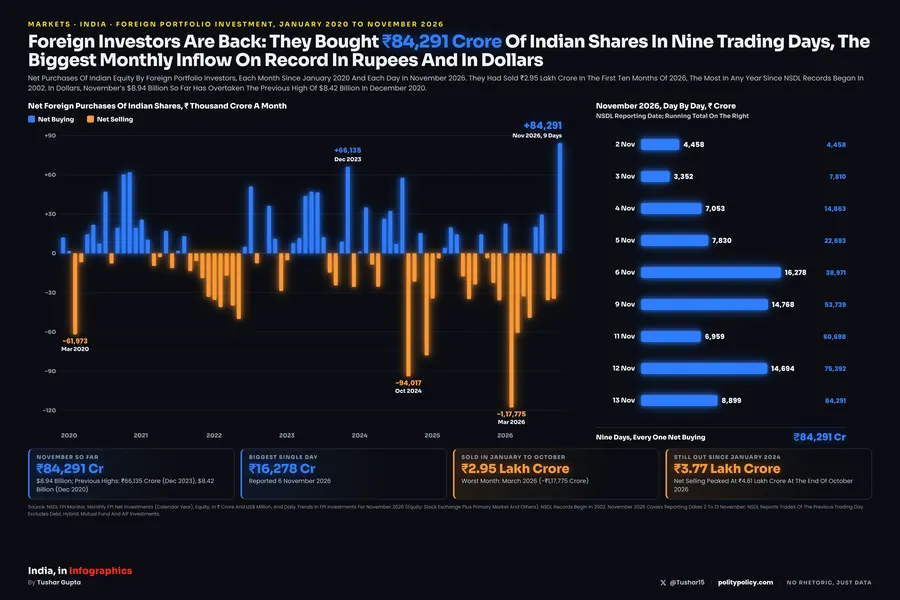
It Touched ₹93.77 On 12 November, Its Strongest Since 21 April, As Crude Fell And Foreign Investors Returned.
What The Chart Says
Brent Spot Went From $71 Before The War To $138 In April, $69 In July, $136 In October And $92 On 11 November. The Rupee Weakened From ₹91.0 To ₹96.8 And Stayed Weak Through The Summer, Then Recovered To ₹94.1 By 16 November, Its Strongest Level Since April, As Crude Fell And Foreign Portfolio Investors Turned Net Buyers.
How This Was Built
The Prices
Daily Spot Prices. Crude: Brent Europe (DCOILBRENTEU) And WTI Cushing (DCOILWTICO), US EIA Via FRED, As Published, 16 February To 11 November 2026. Rupee: RBI Reference Rate, In Rupees Per Dollar, To 16 November. Business Days Only; Missing Days Are Bridged By The Line. Updated 16 November 2026: The Earlier Version Used The US Federal Reserve Rupee Rate And Replaced Five Brent Spot Prints With Futures Levels; All Prices Are Now As Published.
The War Events
The Nine Numbered Markers Are Dated From News Reporting: The UK Parliament Research Briefing On The Strait Of Hormuz (Events 1 To 4), PBS (The Geneva Reopening Deal), CNN (The July Resumption Of Strikes And The $100 Escalation), CNBC (The September Re-Surge) And CNBC And NBC News (The Fall After The US Midterms). Click A Marker To Drop A Line Through The Chart And Compare Before And After.
Sources: FRED / US EIA (Crude) And RBI (Rupee); War Timeline From UK Parliament, PBS, CNN, CNBC And NBC News. The War-Risk Premium Overlay (Toggle) Is A Few Reported Quotes (% Of Hull Value At A Few Dates, Not A Daily Series) From The National, Al Jazeera, Lloyd’s List And S&P Global. Retrieved 16 November 2026.