India, in Infographics: Markets
Foreign Investors Are Back: They Bought ₹75,392 Crore Of Indian Shares In Eight Trading Days, The Biggest Monthly Inflow On Record
Net Purchases Of Indian Equity By Foreign Portfolio Investors, Each Month Since January 2020 And Each Day In November 2026. Hover Or Tap A Bar.
Net Purchases Of Indian Equity By Foreign Portfolio Investors Each Month Since January 2020; November 2026 Is Month To Date. Below: Each NSDL Reporting Day In November. Hover Or Tap A Bar For The Numbers; Switch Between Rupees And Dollars Above.
November So Far
₹75,392 Cr
Eight Trading Days
Biggest Day
₹16,278 Cr
Reported 6 November
Sold, Jan To Oct 2026
₹2.95 Lakh Crore
Most In Any Year On Record
Still Out
₹3.86 Lakh Crore
Net Since January 2024
The Bottom Line
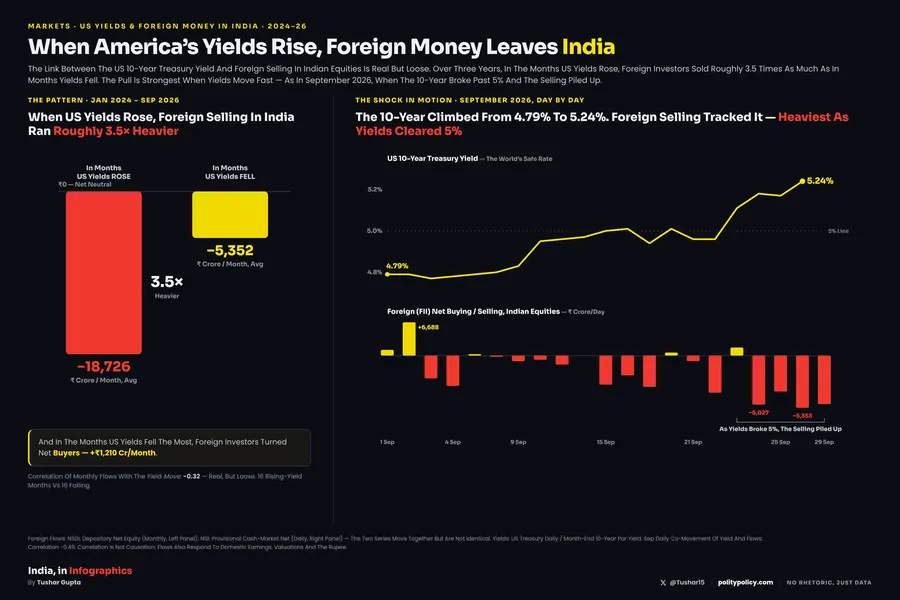
Foreign Portfolio Investors Bought ₹75,392 Crore Of Indian Shares In The First Eight Trading Days Of November 2026, The Biggest Monthly Inflow In Rupees On NSDL Record. It Follows ₹2.95 Lakh Crore Of Selling From January To October, And They Remain Net Sellers Of ₹3.86 Lakh Crore Since January 2024.
What The Data Shows
A Record In Rupees
Foreign Portfolio Investors Bought A Net ₹75,392 Crore Of Indian Shares On The Eight NSDL Reporting Days From 2 To 12 November 2026, And Were Net Buyers On Every One. No Full Month Since NSDL Records Began In 2002 Saw More; The Previous High Was ₹66,135 Crore In December 2023.
After The Worst Year
From January To October 2026 They Sold A Net ₹2.95 Lakh Crore, With Outflows In Seven Of The Ten Months And ₹1,17,775 Crore In March Alone. Even With November, 2026 Is At −₹2.20 Lakh Crore, Still The Worst Year On Record, Ahead Of 2025 (−₹1.66 Lakh Crore).
What Analysts Cite
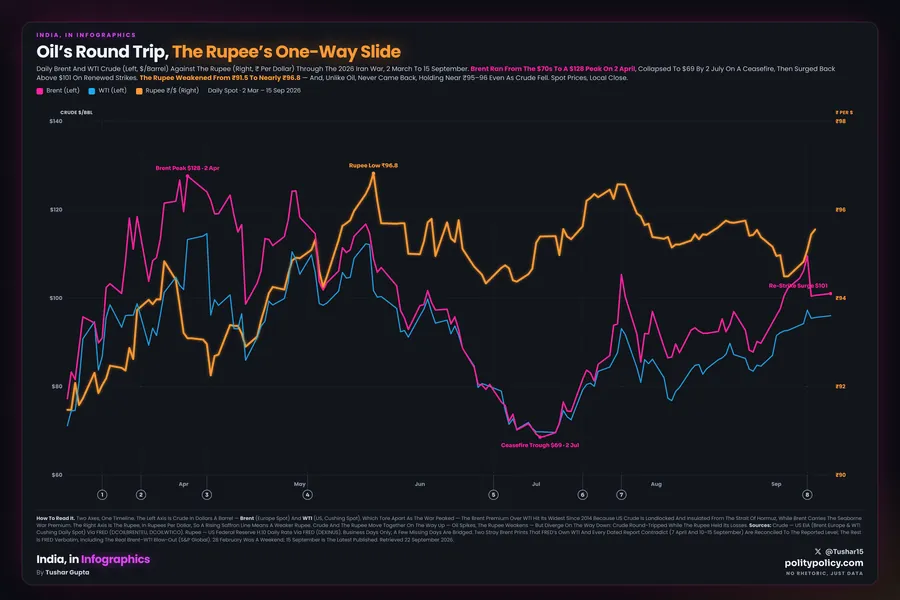
Brokerages Quoted In The Press Point To Money Leaving AI Heavy Markets After The 5 November Sell Off In US Technology Shares, Lower Crude Prices, A Firmer Rupee And Valuations Closer To Their Averages. These Are Explanations Offered By Market Participants, Not Measured In The Data.
Read With Care
Month To Date
November Covers Eight Reporting Days And Will Change. NSDL Reports Each Day The Trades Of The Previous Trading Day.
Rupees And Dollars
In Dollars, November’s $7.99 Billion Ranks Third, Behind December 2020 ($8.42 Billion) And November 2020 ($8.13 Billion), Because The Rupee Is Weaker Now.
Equity Only
These Are Net Equity Investments: Stock Exchange Plus Primary Market And Others. Debt, Hybrid, Mutual Fund And AIF Flows Are Excluded.