India, in Infographics: Economy
Wholesale Inflation Hits 12.3%, Twice Retail Inflation’s 6.1%, As Fuel And Power Prices Rise 33% In A Year
Wholesale (WPI) Against Retail (CPI) Inflation Each Month, January 2022 To October 2026. Hover Or Tap For A Month.
Year-On-Year Inflation Each Month, January 2022 To October 2026. The Shaded Band Is The Gap When Wholesale Inflation Is Above Retail. Fuel And Food Lines Start In April 2024, On The New WPI Series. Hover Or Tap For A Month’s Rates.
Wholesale, October
12.29%
From 11.39% In September
WPI Fuel And Power
32.84%
Mineral Oils 45.57%
Retail, October
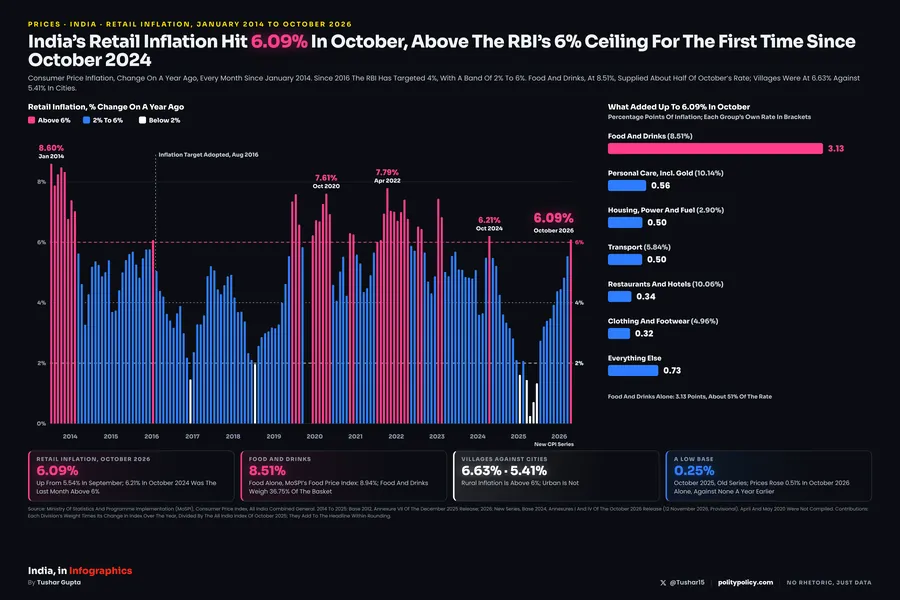
6.09%
From 5.54% In September
The Gap
6.2 Pts
Widest Since July 2022
The Bottom Line
Wholesale Inflation Reached 12.29% In October 2026, Twice The 6.09% Rate Of Retail Inflation, With Fuel And Power Prices Up 32.84% On The Year. The Gap Between The Two, 6.2 Points, Is The Widest Since July 2022.
What The Data Shows
Wholesale Prices Turned Fast
WPI Inflation Was −1.18% In October 2025. It Turned Positive In January 2026 And Reached 12.29% In October 2026, The Highest Since The New Series Begins. On The Old 2011-12 Series It Last Exceeded That In August 2022 (12.48%), Below The May 2022 Peak Of 16.63%.
Fuel Led It
Fuel And Power Prices Were Up 32.84% On The Year In October, With Mineral Oils (Petrol, Diesel And Other Refined Products) Up 45.57% And Crude Petroleum And Natural Gas Up 70.80%. Electricity Turned From Falling Prices In September To 8.06% In October. Manufactured Products, 63% Of The Index, Were Up 9.54%.
Retail Has Risen More Slowly
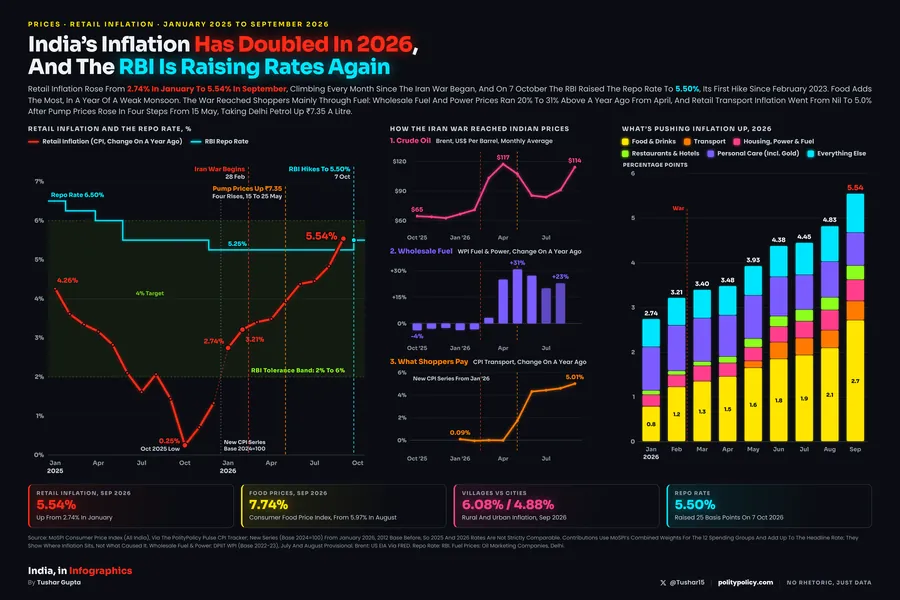
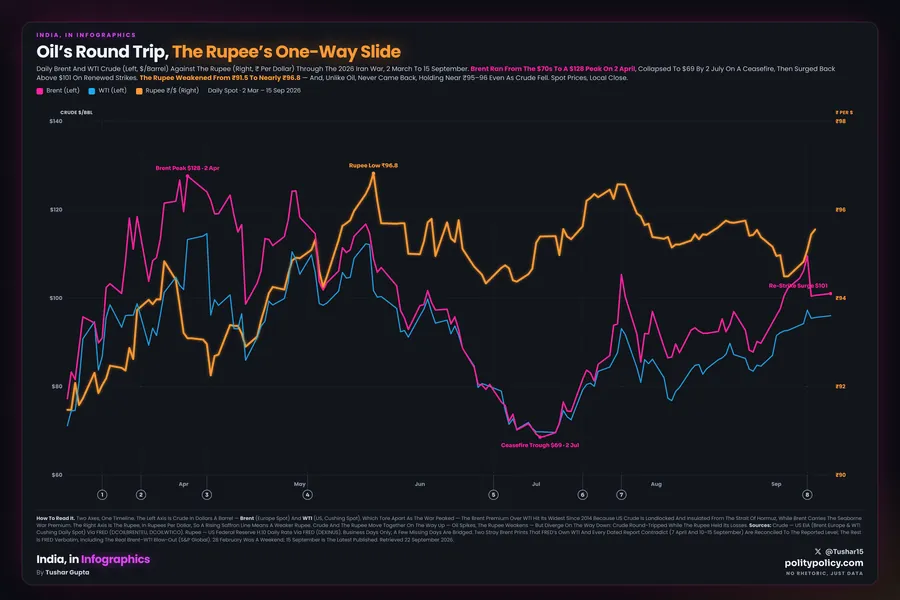
CPI Inflation Rose From 2.74% In January 2026 To 6.09% In October, Above The RBI’s 6% Upper Band For The First Time This Year. Wholesale Price Changes Typically Reach Retail Prices With A Lag, And Pump Prices Of Petrol And Diesel Have Risen Far Less Than Crude Since The War Began.
Read With Care
Two New Series
WPI Moved To A 2022-23 Base, With Rates From April 2024; CPI Moved To A 2024 Base From January 2026. Rates Across A Base Change Are Not Strictly Comparable, So The Chart Marks Both Breaks.
Different Baskets
WPI Measures Prices At The First Point Of Bulk Sale And Has No Services; CPI Measures Retail Prices Paid By Households And Includes Housing, Education, Health And Other Services. Food Weighs More In CPI.
Provisional Months
September And October 2026 WPI Are Provisional And Are Usually Revised Two Months Later. August 2026 Was Confirmed Unchanged At 9.92%.
Sources & Method
Data
WPI: Office Of The Economic Adviser, DPIIT, Monthly Indices For All Commodities, Fuel And Power And The WPI Food Index; Rates For May To October 2026 As Published In The 16 November 2026 Release, Earlier Rates Computed From The Official Indices. CPI: MoSPI All-India Combined Headline Inflation As Published, Including October 2026 (Released 12 November 2026).
Data: WPI Press Release, October 2026 · MoSPI CPI Releases.