India, in Infographics: Trade
India’s Pharma Exports Tripled To $29.7 Billion Between 2010-11 And 2025-26; Its Bulk Drug Imports Rose 2.7 Times By Weight And 1.7 Times By Value
Pharmaceutical Exports, Bulk Drug (API) Imports By Weight And Value, The Price Per Kilogram And China’s Share, 2010-11 To 2025-26. Switch Views Or Hover.
US$, Fiscal Years (April To March); 2024-25 Onwards Provisional. Switch Views, And Hover Or Tap A Bar.
Pharma Exports, 2025-26
$29.7 Bn
83% Formulations; $9.9 Bn In 2010-11
API Imports, 2025-26
510 Mn Kg
Worth $4.48 Bn; 190 Mn Kg In 2010-11
Import Price Per Kg, 2025-26
$8.80
Down From $13.54 In 2010-11
From China, 2024-25
74.8%
Of API Imports By Value, Up From 68.1% In 2020-21
The Bottom Line
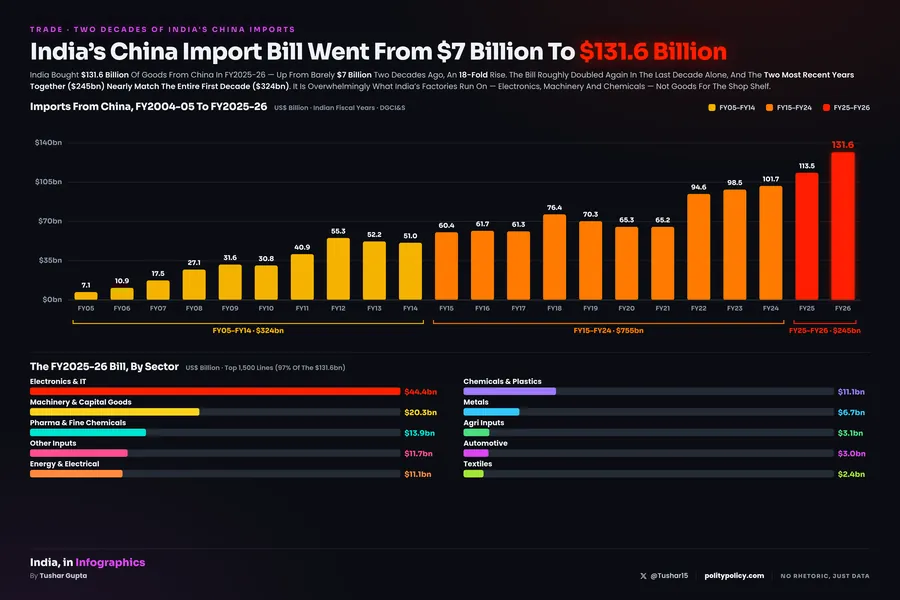
India Exported $29.7 Billion Of Medicines In 2025-26 And Imported 510 Million Kg Of APIs, 74.8% Of Them (By Value) From China. New PLI Plants Can Replace About 11% Of That Weight.
What The Data Shows
Exports Tripled
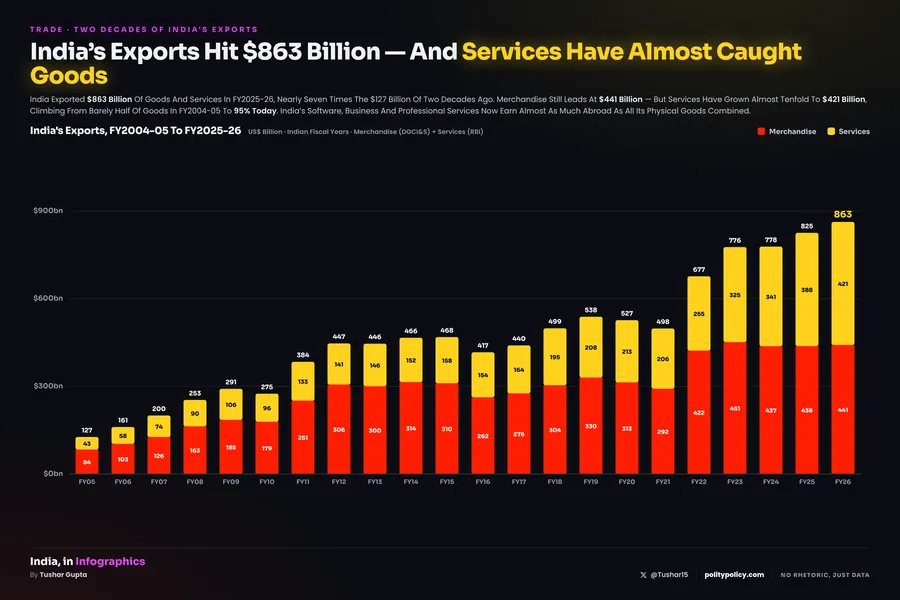
Pharma Exports Rose From $9.9 Billion In 2010-11 To $29.7 Billion In 2025-26, The Highest On Record. Formulations And Biologicals Were 83%. April To September 2026 Brought $15.4 Billion, Up 5.0%.
More APIs, Cheaper
API Imports Rose 2.7 Times By Weight But Only 1.7 Times By Value, So The Price Per Kilogram Fell From $13.54 To $8.80. Value Peaked At $4.73 Billion In 2021-22. April To September 2026: 243 Million Kg, Down 3.7%.
Bulk Drugs Both Ways
India Also Exports Bulk Drugs: $5.08 Billion In 2025-26, More Than The $4.48 Billion It Imported. Exports Were Higher In Every Year Since 2010-11 Except 2021-22.
Making APIs At Home
The PLI Scheme For Bulk Drugs (₹6,940 Crore, 2020) Covers 41 Critical Products. By December 2025 It Had Added 56,800 Tonnes A Year Of Capacity For 28 Products, About 11% Of The Weight Of All API Imports In 2025-26. 39 Of 48 Projects Were Commissioned By June 2026.
Read With Care
Two Different Lists
Weight And Value Use The DGCI&S Bulk Drugs Group (H5). China’s Share Comes From The Department Of Pharmaceuticals, Which Counts A Wider List Of About 200 API Categories, In Rupees.
April To September 2026
TRADESTAT’s Cumulative Import Figure For April To September 2026 Leaves Out April; The Figures Here Add Up The Six Months One By One.
Capacity Is Not Output
PLI Capacity Is What New Plants Can Make In A Year, Not What They Made. Sales Under The Scheme Reached ₹3,792 Crore By June 2026.
Sources & Method
Data
Department Of Commerce TRADESTAT, Monthly Foreign Trade Statistics (DGCI&S Principal Commodities): H5 Bulk Drugs, Drug Intermediates And H8 Drug Formulations, Biologicals, In US$ And Kg, 2010-11 To 2025-26 And April To September 2026. China Share: Department Of Pharmaceuticals Reply In Parliament (PIB, 10 March 2026). PLI Scheme For Bulk Drugs: PIB Releases Of 6 December 2024, 16 December 2025, 10 And 20 March 2026 And 25 September 2026.
TRADESTAT · PIB.