India, in Infographics: Digital Payments
UPI Averaged Over 800 Million Payments A Day For The First Time In September 2026
UPI Averaged 802 Million Payments A Day In September 2026, The First Month To Average Above 800 Million, Up From 136 Million In October 2021. The Average Value Moved Each Day Rose To ₹97,900 Crore.
Every Figure Is A Daily Average: The Month’s Total Divided By Its Number Of Days; Individual Days Run Higher Or Lower. Hover Any Month For Its Figures. Bars Read Against The Left Scale (Million), The Line Against The Right (₹ Crore). Both Start At Zero; Where The Line Sits Against The Bars Carries No Meaning.
First Month Averaging Over 800 Million
802 Million
Average Payments A Day, September 2026
Five Years Of Volume
5.9×
Daily Average, 136 Million (Oct 2021) To 802 Million
Average Value Moved A Day
₹97,900 Cr
3.9× Since Oct 2021 · A Record
The Average Payment
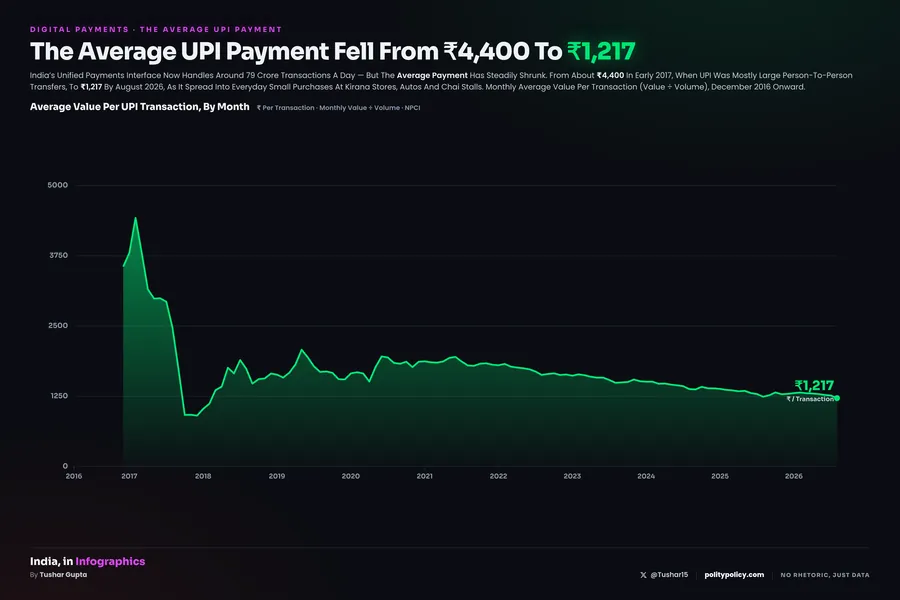
₹1,829 → ₹1,220
Value ÷ Volume, Oct 2021 Vs Sep 2026
The Bottom Line
September 2026 Is The First Month UPI Averaged More Than 800 Million Payments A Day: 802.3 Million, Against A Previous High Of 790.6 Million In August. The Average Value Moved Each Day Also Set A Record At ₹97,900 Crore, But Since February The Count Of Payments Has Grown Nearly Five Times Faster Than The Money.
What The Chart Shows
Volume Rose In 58 Of 59 Months
Average Payments A Day Climbed From 136 Million In October 2021 To 802 Million In September 2026. The Only Monthly Dip In Five Years Came In November 2024. The Daily Average First Passed 500 Million In September 2024, 700 Million In January 2026, And 800 Million Just Eight Months Later.
Value Has Grown More Slowly
The Average Value Moved Each Day Rose 3.9 Times, From ₹24,885 Crore To ₹97,900 Crore, Against 5.9 Times For The Number Of Payments. Since February 2026 It Has Stayed Between ₹95,000 And ₹98,000 Crore A Day: Up 2% While Payments A Day Rose 10%.
Because Each Payment Is Smaller
The Average UPI Payment Fell From ₹1,829 In October 2021 To ₹1,220 In September 2026, And From ₹1,316 In February 2026 Alone. More Of UPI Is Now Small, Everyday Spending, So The Count Of Payments Runs Ahead Of The Money.
Sources & Method
The Data
NPCI UPI Product Statistics: Monthly Totals Of Transactions (Million) And Value (₹ Crore), As Published, Taken From The Backend Of The PolityPolicy Pulse UPI Tracker On 5 October 2026.
Daily Average
Each Month’s Total Divided By The Number Of Days In That Month, So February’s 28 Days Do Not Read As A Slowdown. The Average Payment Is Value Divided By Volume.
September 2026
NPCI’s Month-End Release, Published Rounded: 24.07 Billion Payments Worth ₹29.37 Lakh Crore. That Is 802.3 Million A Day, 2.3 Million Above The Mark. The Previous High Was August 2026 At 790.6 Million.
NPCI Excludes Transactions That Debit And Credit The Same Account. Values Are Nominal Rupees, Not Adjusted For Inflation. Source: NPCI UPI Product Statistics; Monthly Series Also On politypolicy.com/pulse/UPI.