The Numbers
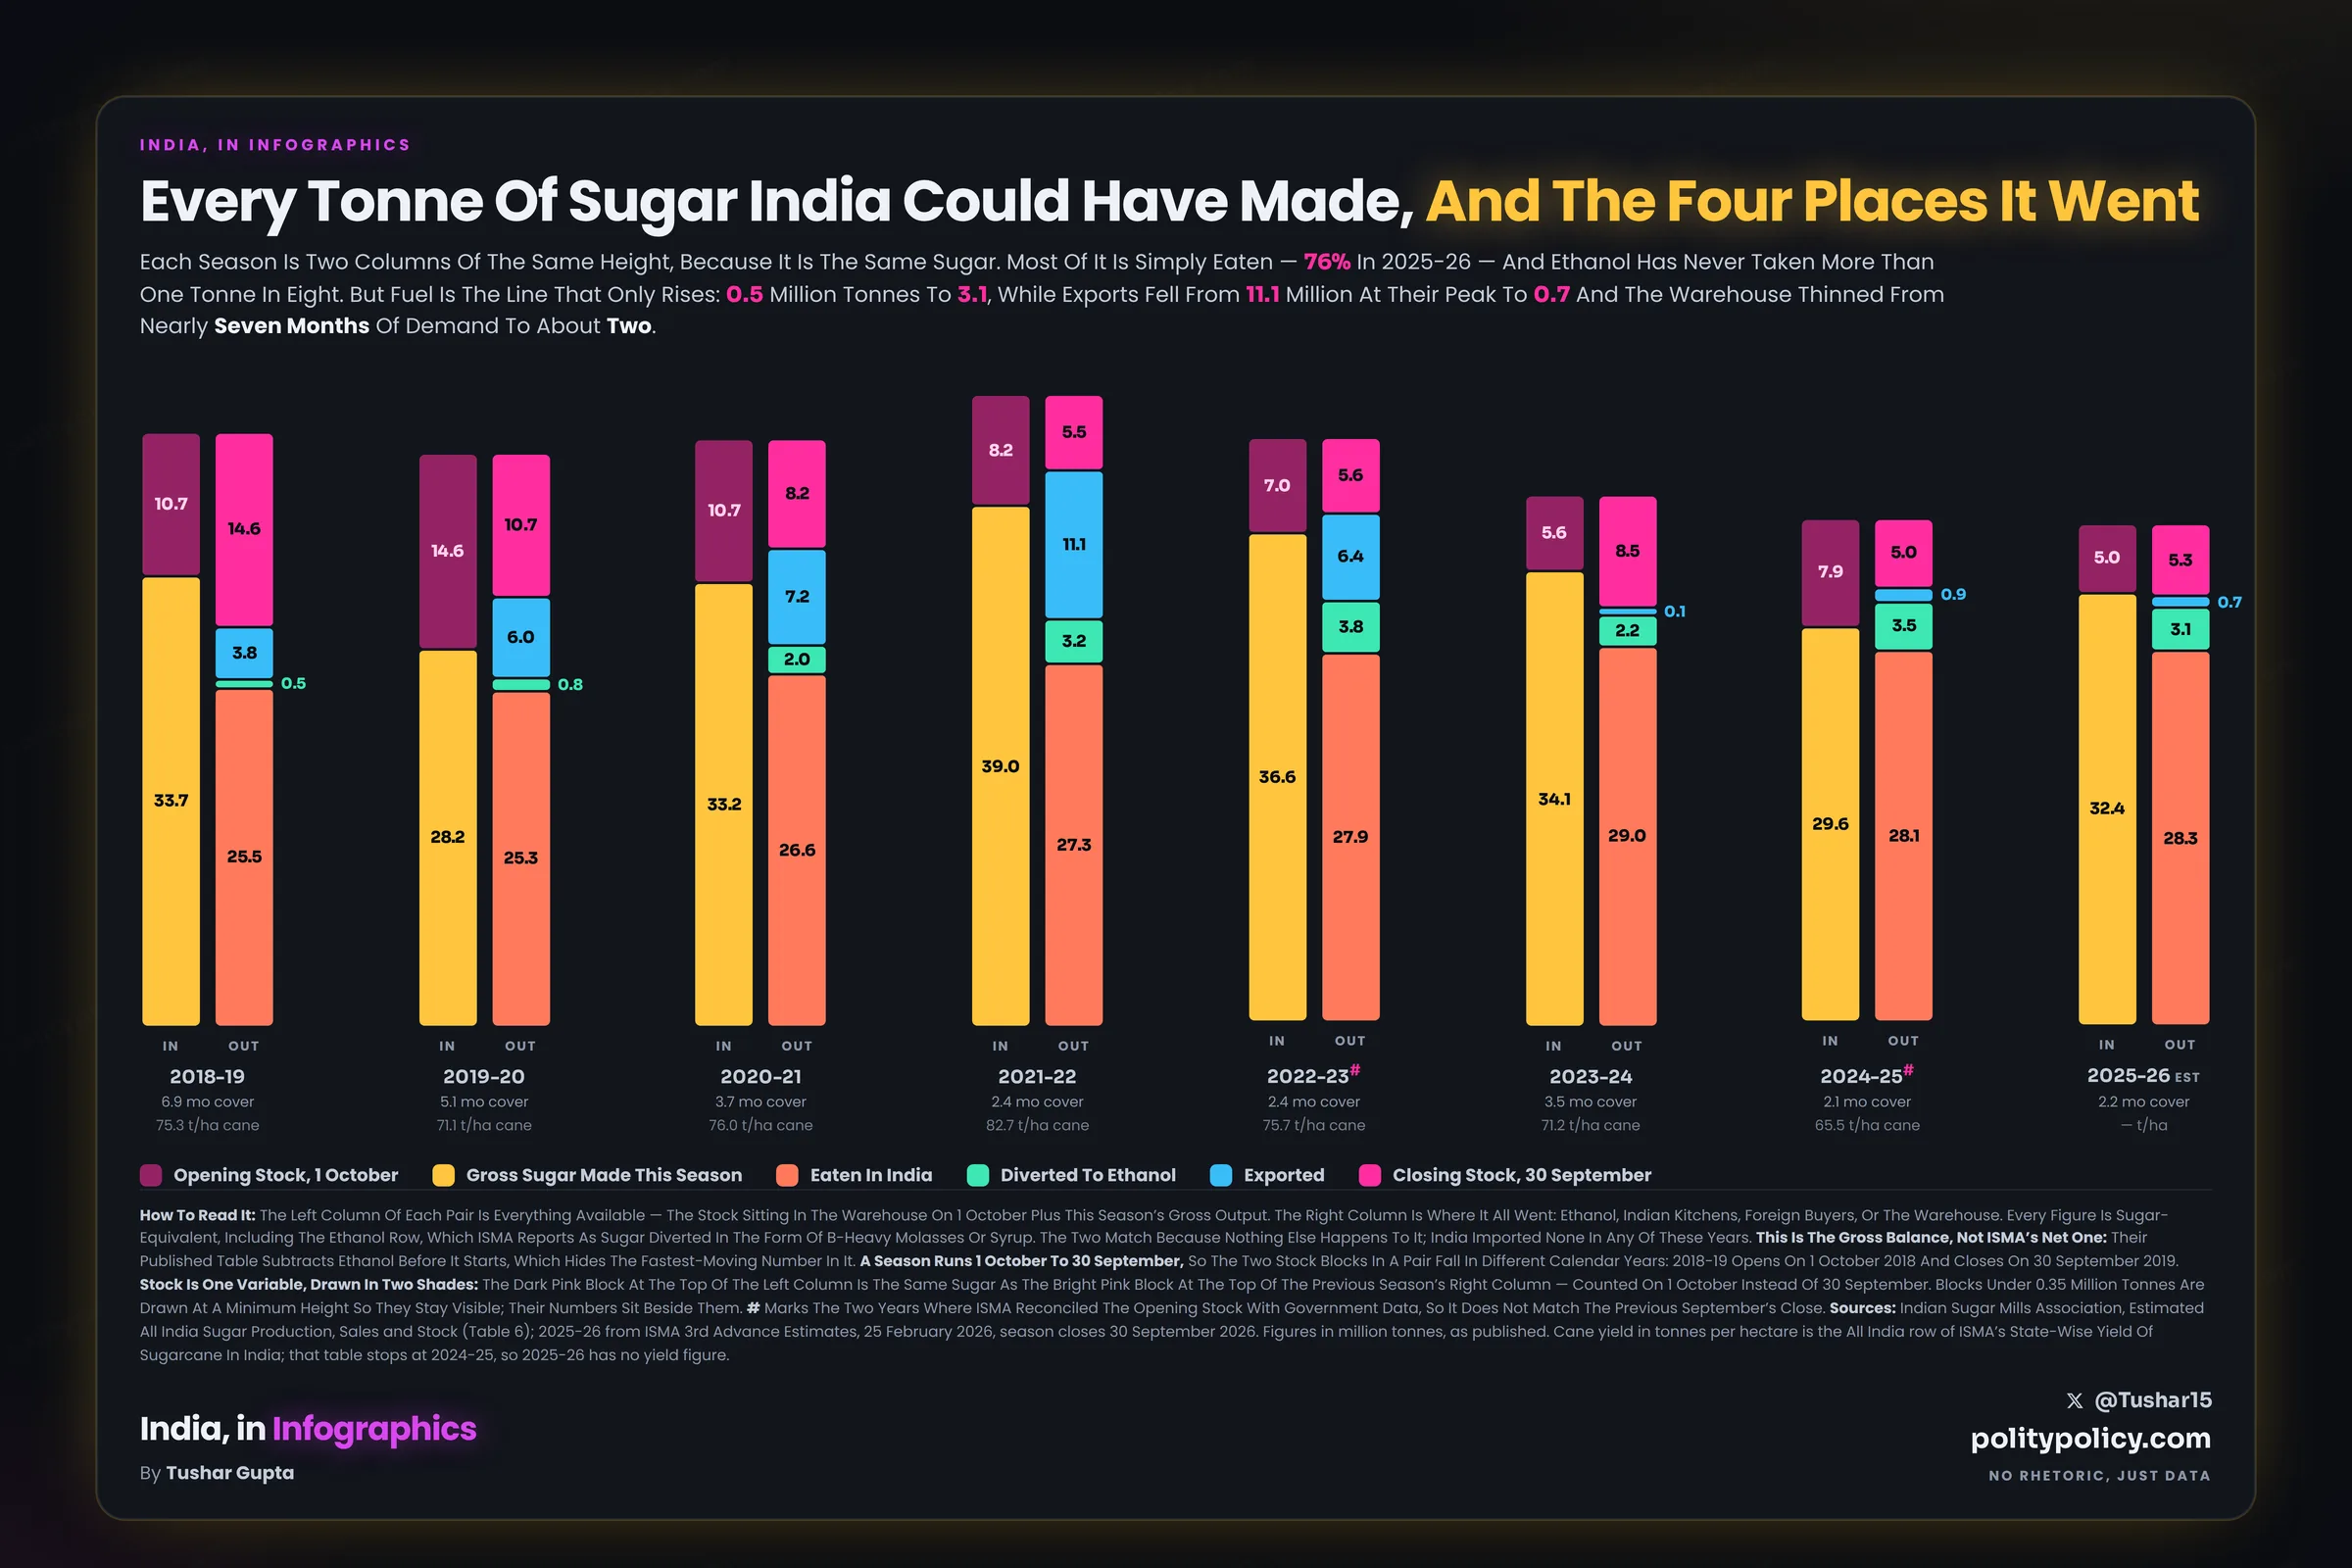
Every figure the graphic draws, and ISMA’s own table beside it. All in million tonnes, sugar-equivalent. Rank the two views against each other and you can see exactly what the gross basis puts back in.
Stock on 1 Oct
Gross sugar made
Eaten in India
To ethanol
Exported
Stock on 30 Sept
| Season | Stock1 Oct | Gross sugarmade | Total in | Eatenin India | To ethanol | Exported | Stock30 Sept | Total out |
|---|---|---|---|---|---|---|---|---|
| 2018-19 | 10.7 | 33.7 | 44.4 | 25.5 | 0.5 | 3.8 | 14.6 | 44.4 |
| 2019-20 | 14.6 | 28.2 | 42.8 | 25.3 | 0.8 | 6.0 | 10.7 | 42.8 |
| 2020-21 | 10.7 | 33.2 | 43.9 | 26.6 | 2.0 | 7.2 | 8.2 | 44.0 |
| 2021-22 | 8.2 | 39.0 | 47.2 | 27.3 | 3.2 | 11.1 | 5.5 | 47.1 |
| 2022-23 # | 7.0 | 36.6 | 43.6 | 27.9 | 3.8 | 6.4 | 5.6 | 43.7 |
| 2023-24 | 5.6 | 34.1 | 39.7 | 29.0 | 2.2 | 0.1 | 8.5 | 39.8 |
| 2024-25 # | 7.9 | 29.6 | 37.5 | 28.1 | 3.5 | 0.9 | 5.0 | 37.5 |
| 2025-26 est | 5.0 | 32.4 | 37.4 | 28.3 | 3.1 | 0.7 | 5.3 | 37.4 |
Total in and total out match on every season — that is the whole point of
the graphic, and the reason its two columns are the same height. Where they differ by 0.1 it is
ISMA’s own rounding to one decimal, not a missing tonne. India imported no sugar in any of
these eight years.
# marks the two seasons where ISMA reconciled the opening stock with Government data, so it does not equal the previous 30 September’s close: 2021-22 shuts at 5.5 but 2022-23 opens at 7.0, and 2023-24 shuts at 8.5 but 2024-25 opens at 7.9. The graphic keeps those breaks rather than smoothing them.
# marks the two seasons where ISMA reconciled the opening stock with Government data, so it does not equal the previous 30 September’s close: 2021-22 shuts at 5.5 but 2022-23 opens at 7.0, and 2023-24 shuts at 8.5 but 2024-25 opens at 7.9. The graphic keeps those breaks rather than smoothing them.
| Season | Opening1 Oct | Grossproduction | To ethanol | Netproduction | Imports | Totalavailability | Internalconsumption | Exports | Totalofftake | Closing30 Sept | Stock% of cons. | Monthsof cover | Cane yieldt/ha |
|---|---|---|---|---|---|---|---|---|---|---|---|---|---|
| 2018-19 | 10.7 | 33.7 | 0.5 | 33.2 | 0.0 | 43.9 | 25.5 | 3.8 | 29.3 | 14.6 | 57.3% | 6.9 | 75.3 |
| 2019-20 | 14.6 | 28.2 | 0.8 | 27.4 | 0.0 | 42.0 | 25.3 | 6.0 | 31.3 | 10.7 | 42.3% | 5.1 | 71.1 |
| 2020-21 | 10.7 | 33.2 | 2.0 | 31.2 | 0.0 | 41.9 | 26.6 | 7.2 | 33.8 | 8.2 | 30.8% | 3.7 | 76.0 |
| 2021-22 | 8.2 | 39.0 | 3.2 | 35.8 | 0.0 | 44.0 | 27.3 | 11.1 | 38.4 | 5.5 | 20.1% | 2.4 | 82.7 |
| 2022-23 # | 7.0 | 36.6 | 3.8 | 32.8 | 0.0 | 39.8 | 27.9 | 6.4 | 34.3 | 5.6 | 20.1% | 2.4 | 75.7 |
| 2023-24 | 5.6 | 34.1 | 2.2 | 32.0 | 0.0 | 37.6 | 29.0 | 0.1 | 29.1 | 8.5 | 29.3% | 3.5 | 71.2 |
| 2024-25 # | 7.9 | 29.6 | 3.5 | 26.1 | 0.0 | 34.0 | 28.1 | 0.9 | 29.0 | 5.0 | 17.8% | 2.1 | 65.5 |
| 2025-26 est | 5.0 | 32.4 | 3.1 | 29.3 | 0.0 | 34.3 | 28.3 | 0.7 | 29.0 | 5.3 | 18.7% | 2.2 | — |
This is ISMA’s balance, which runs on net production. Net is gross minus
the sugar sent to ethanol, so on this basis the diversion has already been taken out before the
balance starts — and the fastest-moving number in the table, ethanol going from
0.5 to 3.1 million tonnes, never appears in it. That is why the
graphic runs on gross instead.
The last two columns are derived, not published: closing stock as a share of that season’s internal consumption is ISMA’s own row D, and months of cover is the same figure × 12 — it is what turns 57% into 6.9 months and 19% into 2.2. The last column is from a different ISMA table again — cane yield in tonnes per hectare, All India. It stops at 2024-25, so 2025-26 is a dash rather than a guess.
A season runs 1 October to 30 September, so a row’s opening and closing stock fall in different calendar years: 2018-19 opens on 1 October 2018 and closes on 30 September 2019.
Sources: Indian Sugar Mills Association, Estimated All India Sugar Production, Sales and Stock (Table 6), for 2018-19 to 2024-25. The 2025-26 column is not from that table: it carried ISMA’s November 2025 estimate, which ISMA superseded on 25 February 2026 with its 3rd Advance Estimates — gross 32.4, net 29.3, consumption 28.3, closing 5.3. Those are the figures used here. The 2025-26 season closes on 30 September 2026.
The last two columns are derived, not published: closing stock as a share of that season’s internal consumption is ISMA’s own row D, and months of cover is the same figure × 12 — it is what turns 57% into 6.9 months and 19% into 2.2. The last column is from a different ISMA table again — cane yield in tonnes per hectare, All India. It stops at 2024-25, so 2025-26 is a dash rather than a guess.
A season runs 1 October to 30 September, so a row’s opening and closing stock fall in different calendar years: 2018-19 opens on 1 October 2018 and closes on 30 September 2019.
Sources: Indian Sugar Mills Association, Estimated All India Sugar Production, Sales and Stock (Table 6), for 2018-19 to 2024-25. The 2025-26 column is not from that table: it carried ISMA’s November 2025 estimate, which ISMA superseded on 25 February 2026 with its 3rd Advance Estimates — gross 32.4, net 29.3, consumption 28.3, closing 5.3. Those are the figures used here. The 2025-26 season closes on 30 September 2026.