India, in Infographics: Markets
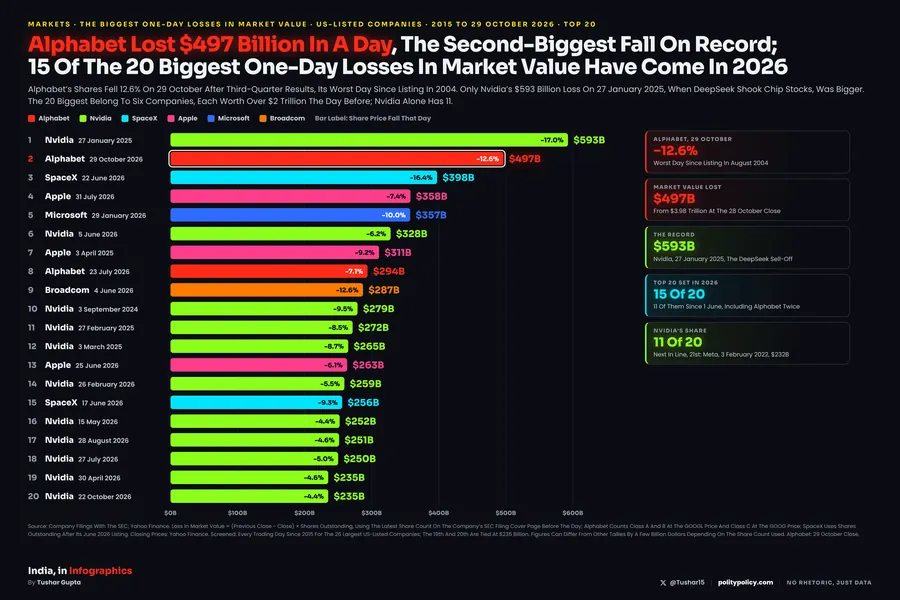
SpaceX, Alphabet And Broadcom Are Down Over 28% From Their 2026 Highs; Apple Closed At A Record The Same Day
Market Value Of Nine US Tech Giants Through 2026, Against Each One’s Highest Close Of The Year. Combined, The Eight That Traded All Year Are 6.1% Below Their 7 October High.
Fall From 2026 High Shows, For Each Day, How Far A Company Was Below Its Highest Close Of 2026 So Far; Market Value Shows The Value Itself. Pick Companies With The Chips And Hover Or Tap Any Day For Every Selected Company’s Value That Day.
Alphabet Since 13 May
−28.4%
$4.86T To $3.48T: $1.38T Lost
Down 20% Or More
3 Of 9
Meta Is Down 19.4%
Eight Giants Combined
−6.1%
Below The 7 October High; Up 8.3% On The Year
Apple, 29 October
Record
Highest Close Ever; Worth $5.09T
The Bottom Line
The Fall In Tech Shares Is Concentrated: Three Of Nine Giants Are More Than 28% Below Their 2026 Highs And Alphabet Alone Has Lost $1.38T Since May, While Apple Is At A Record And Microsoft Is Close To Its High. As A Group, The Eight Are 6.1% Off Their Peak And Still Up 8.3% On The Year.
What The Data Shows
Three Companies In A Bear Market
SpaceX Is 29.3% Below Its 16 June High, Alphabet 28.4% Below 13 May And Broadcom 28.1% Below 2 June. Together They Have Lost $2.83T From Those Highs; Alphabet Alone Lost $1.38T.
Recent Highs, Recent Falls
Meta Peaked On 24 September And Is Down 19.4%. Nvidia Set Its High On 6 October, Worth $5.77T, And Is Down 10.7%, A Loss Of $616 Billion In Three Weeks.
Not Everyone Is Falling
Apple Closed At The Highest Price In Its History On 29 October, Worth $5.09T. Microsoft Is 2.4% Below Its 13 October High.
The Group Is Only Modestly Down
The Eight That Traded All Year Were Worth $26.77T On 7 October And $25.13T On 29 October, 6.1% Less, But Still 8.3% More Than At The End Of 2025. The Nasdaq 100 Is 5.8% Below Its Record Close Of 6 October.
Read With Care
Highs Are Each Company’s Own
Each Fall Is Measured From That Company’s Highest Close In 2026, On Different Dates. Adding Them Up ($4.46 Trillion) Overstates What Was Lost At Any One Time; The Combined Total Of The Eight Fell 6.1% From Its Own High.
Share Counts Step On Filing Dates
Market Value Uses The Share Count On Each Company’s Latest SEC Filing, Which Changes Only When A New Filing Is Made. Tesla’s Count Rose 13% On Its January 2026 Filing, So Its Market Value High Falls On 23 January Though Its Share Price Peaked On 5 January.
SpaceX Listed In June
SpaceX Began Trading On 12 June 2026, So Its High Is From Its First Weeks Of Trading, And It Is Left Out Of The Combined Total.
Sources & Method
Market Value
Daily Close × Shares Outstanding From The Latest SEC Cover Page (10-K, 10-Q, Or For SpaceX In June, The 424B4 Prospectus). Alphabet: Class A And B At The GOOGL Price Plus Class C At The GOOG Price.
Data
Closing Prices And The Nasdaq 100: Yahoo Finance, To The 29 October 2026 Close. Shares Outstanding: SEC EDGAR.
Checks
Values On 29 October Were Recomputed From Closing Prices And The Latest Filings, And Each Company’s High Was Re-Derived Independently; Alphabet’s Loss Since May Matches Reports Of About $1.4 Trillion.
Data: Yahoo Finance · SEC EDGAR · Graphic: The Biggest One-Day Losses.