India, in Infographics: Markets
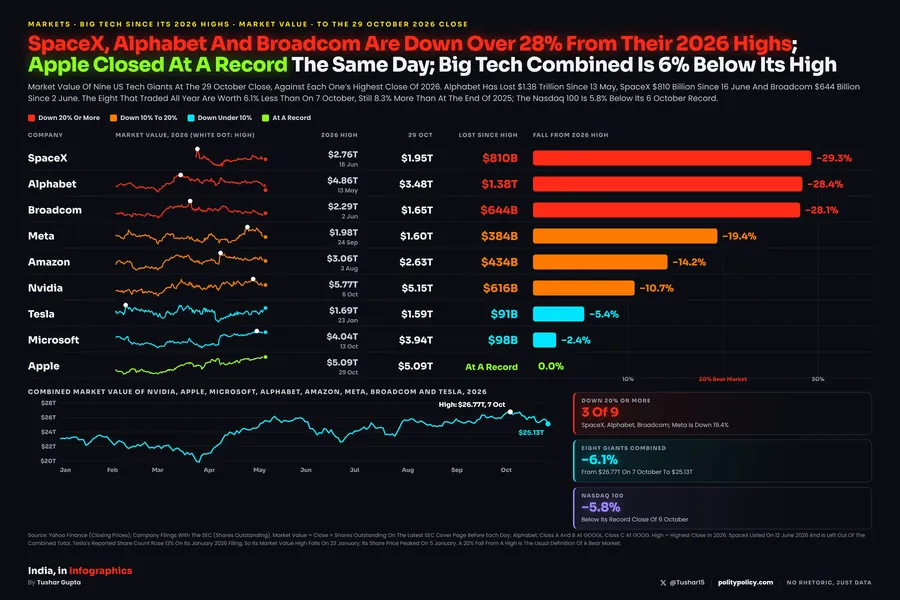
Alphabet Lost $497 Billion In A Day, The Second-Biggest Fall On Record; 15 Of The 20 Biggest One-Day Losses In Market Value Have Come In 2026
The 20 Largest Single-Day Falls In The Market Value Of A US-Listed Company, Computed From Closing Prices And SEC Share Counts. Filter By Company: Nvidia Alone Has 11.
Pick A Company To See Only Its Days. Sort By Dollars Lost, By The Size Of The Share Price Fall, Or By Date. Hover Or Tap A Bar For The Closing Prices, The Share Count Used And The Market Value The Day Before.
Alphabet, 29 October
$497B
Down 12.6%, Its Worst Day Since Listing In 2004
The Record
$593B
Nvidia, 27 January 2025, Down 17.0%
Set In 2026
15 Of 20
11 Of Them Since 1 June
Nvidia’s Days
11 Of 20
More Than Every Other Company Combined
The Bottom Line
Alphabet’s $497 Billion Fall On 29 October Is The Second-Largest One-Day Loss In Market Value On Record, Behind Nvidia In January 2025. The List Is Dominated By 2026 And By Nvidia, Because Four Companies Have Been Worth Over $4 Trillion In 2026: A Fall Of 4% To 5% At That Size Erases Over $200 Billion.
What The Data Shows
Alphabet’s Day Ranks Second
Alphabet Fell 12.6% On 29 October After Third-Quarter Results, Taking $497 Billion Off A Market Value Of $3.98 Trillion. Only Nvidia’s $593 Billion Loss On 27 January 2025 Was Bigger. Alphabet’s Earlier Worst, 23 July 2026, Is Eighth.
Nvidia Owns The List
Nvidia Has 11 Of The 20 Days. Because It Has Been Worth Over $4 Trillion Throughout 2026, A 4.4% Fall Was Enough To Erase $235 Billion On 22 October; Meta Needed A 26.4% Fall In February 2022 To Lose Slightly Less.
Bigger Companies, Bigger Days
Every Company On The List Was Worth Over $2 Trillion The Day Before. Fifteen Of The 20 Days Came In 2026, 11 Of Them Since 1 June, As Four Companies Passed $4 Trillion And Then Fell Sharply On Results.
Dollars And Percentages Tell Different Stories
Sorted By The Share Price Fall, Nvidia’s 17.0% In January 2025 And SpaceX’s 16.4% In June 2026 Lead; Several Nvidia Days On The List Were Falls Of Under 5%.
Read With Care
A Loss In Market Value Is Not Cash
It Is The Change In The Price Of All Shares On One Day. Nobody Paid Or Lost This Money In Cash, And Some Or All Of It Can Return In Later Sessions.
Share Counts Matter
Each Loss Uses The Share Count On The Latest SEC Filing Cover Page Before The Day. Other Tallies Use Other Counts, So Figures Can Differ By A Few Billion Dollars; Ranks 19 And 20 Are Tied At $235 Billion, And Meta’s $232 Billion In 2022 Is Close Behind.
US-Listed Companies
The Screen Covers Every Trading Day Since 2015 For The 26 Largest US-Listed Companies By Market Value. Earlier, No Company Was Large Enough To Lose $235 Billion In A Day.
Sources & Method
Formula
Loss = (Previous Close − Close) × Shares Outstanding. Alphabet: Class A And B Shares At The GOOGL Price Plus Class C At The GOOG Price. SpaceX: Shares Outstanding After Its June 2026 Listing, From Its Prospectus.
Data
Closing Prices: Yahoo Finance (Split-Adjusted, With Share Counts Converted To The Same Basis). Shares Outstanding: SEC EDGAR Cover Pages (10-K, 10-Q, 424B4).
Checks
Six Results Were Compared With Reported Figures: Nvidia ($593B, 2025), SpaceX (About $400B), Microsoft ($357B), Apple ($311B, 2025), Alphabet ($294B, July 2026) And Nvidia ($279B, 2024). All Agree Within 1.5%. Alphabet’s 29 October Loss Matches Reports Of About $500 Billion.
Data: SEC EDGAR · Yahoo Finance, Price History · Graphic: Big Tech Since Its 2026 Highs.