India, in Infographics: Climate
East And Northeast India Just Had Its Driest Monsoon Since 1901, And The South Peninsula Its Fourth Driest
Every June To September Monsoon Since 1901 For IMD’s Four Regions And All India, As A Share Of Normal, With 2026 Marked. Pick A Region; Hover Or Tap A Bar.
Each Bar Is One June To September Monsoon Since 1901, Drawn Up Or Down From The Region’s Normal; Magenta Is Below Normal, Yellow Above. The White Bar Is 2026 And The Dashed Line Marks Its Level. Hover Or Tap A Bar For The Year.
East & Northeast
74%
Of Normal; Lowest Since 1901
South Peninsula
76%
Of Normal; 4th Lowest Since 1901
All India
87%
13th Lowest Since 1901
June, All India
65%
The Driest Month Of The Season
The Bottom Line
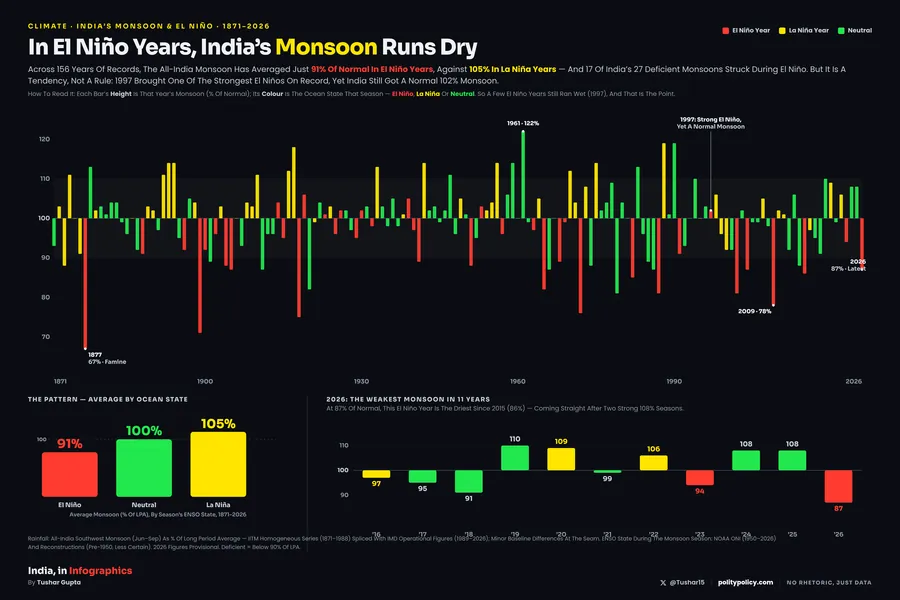
India’s 2026 Monsoon Ended At 87% Of Normal, Its 13th Lowest Since 1901. The Shortfall Was Regional: East And Northeast India Had Its Driest Season On Record At 74%, And The South Peninsula Its Fourth Driest At 76%, While The Northwest And Centre Were Normal.
What The Data Shows
A Record In The East
East And Northeast India Got 1,016 mm Against A Normal Of 1,367 mm, 74% Of Normal, Below Every Season Since 1901. It Follows A Dry 2025, When The Region Got About 81%.
The South Ran Short Too
The South Peninsula Got 542 mm Against 716 mm, 76% Of Normal: Its Fourth Lowest Since 1901 And Second Lowest Since 2001, After 2002.
The National Figure Hides It
All India Got 759.4 mm, 87% Of Normal, Its 13th Lowest Since 1901. Northwest India (94%) And Central India (97%) Stayed Within Their Normal Range, Which Pulled The Average Up.
Read With Care
Two Data Sources
2026 Comes From IMD’s End Of Season Report. 1901 To 2025 Are Rebuilt From IMD’s Gridded Daily Rainfall, Which Can Differ From IMD’s Station Based Regional Series By A Point Or Two.
One Near Tie
On The Gridded Data, 1987 In The South Peninsula Sits At 75.5%, 0.2 Points Below 2026. IMD’s Own Series Ranks 2026 Fourth, And The Card Follows IMD.
Normal Is Relative
Each Region Is Measured Against Its Own 1971 To 2020 Average. East And Northeast India Normally Gets About 1,367 mm, Nearly Twice The South Peninsula’s 716 mm.
Sources & Method
Data
2026: IMD Press Release, 30 September 2026, Table Of Regional Rainfall Against The Long Period Average. 1901 To 2025: IMD Pune 0.25° Gridded Daily Rainfall, Summed 1 June To 30 September Per Grid Cell, Area Weighted Over Each Region, As A Share Of That Region’s 1971 To 2020 Mean. States Are Assigned To IMD’s Four Homogeneous Regions.
Data: IMD · IMD Pune Gridded Rainfall.